

Question: Use the given data set to complete parts a through c below Use 0 05 13 8 74 9 8 78 X y Click here

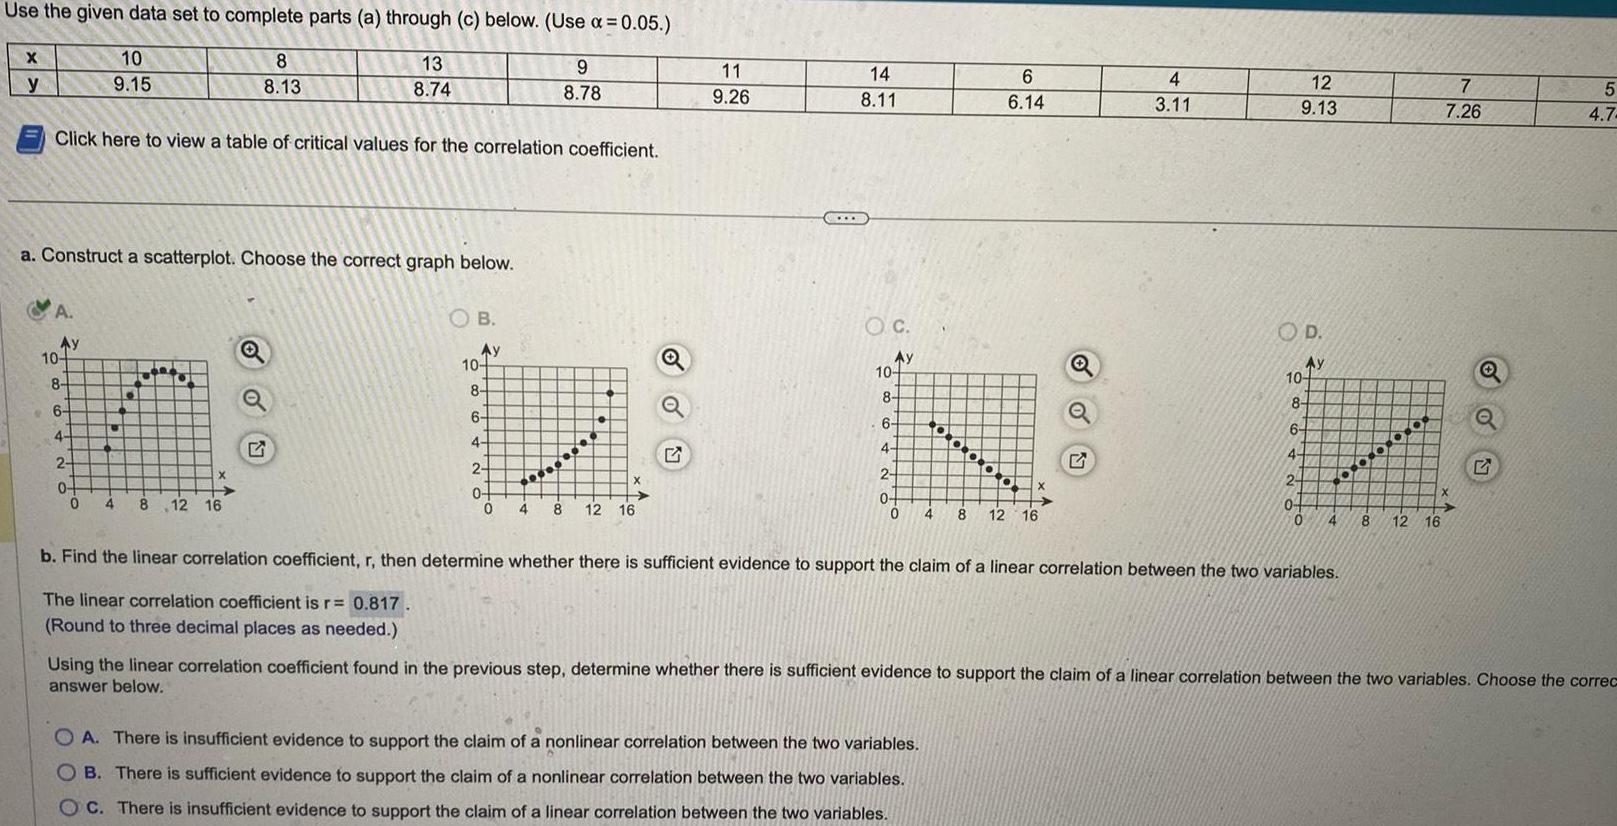
Use the given data set to complete parts a through c below Use 0 05 13 8 74 9 8 78 X y Click here to view a table of critical values for the correlation coefficient A a Construct a scatterplot Choose the correct graph below Ay 10 8 10 9 15 6 4 2 0 0 4 1 8 8 13 X 8 12 16 OB Ay 10 8 6 4 2 0 0 4 8 12 16 o 11 9 26 14 8 11 OC Ay 10 8 6 N 4 2 0 0 4 6 6 14 X OA There is insufficient evidence to support the claim of a nonlinear correlation between the two variables B There is sufficient evidence to support the claim of a nonlinear correlation between the two variables OC There is insufficient evidence to support the claim of a linear correlation between the two variables 8 12 16 Q 4 3 11 12 9 13 OD Ay 10 8 6 4 2 0 0 4 b Find the linear correlation coefficient r then determine whether there is sufficient evidence to support the claim of a linear correlation between the two variables The linear correlation coefficient is r 0 817 Round to three decimal places as needed 8 12 16 7 7 26 Q 5 4 7 Using the linear correlation coefficient found in the previous step determine whether there is sufficient evidence to support the claim of a linear correlation between the two variables Choose the correc answer below
Step by Step Solution
There are 3 Steps involved in it

Get step-by-step solutions from verified subject matter experts