

Question: Use the given data set to complete parts (a) through (c) below. (Use a = 0.05.) X 10 8 13 9 11 14 6 4
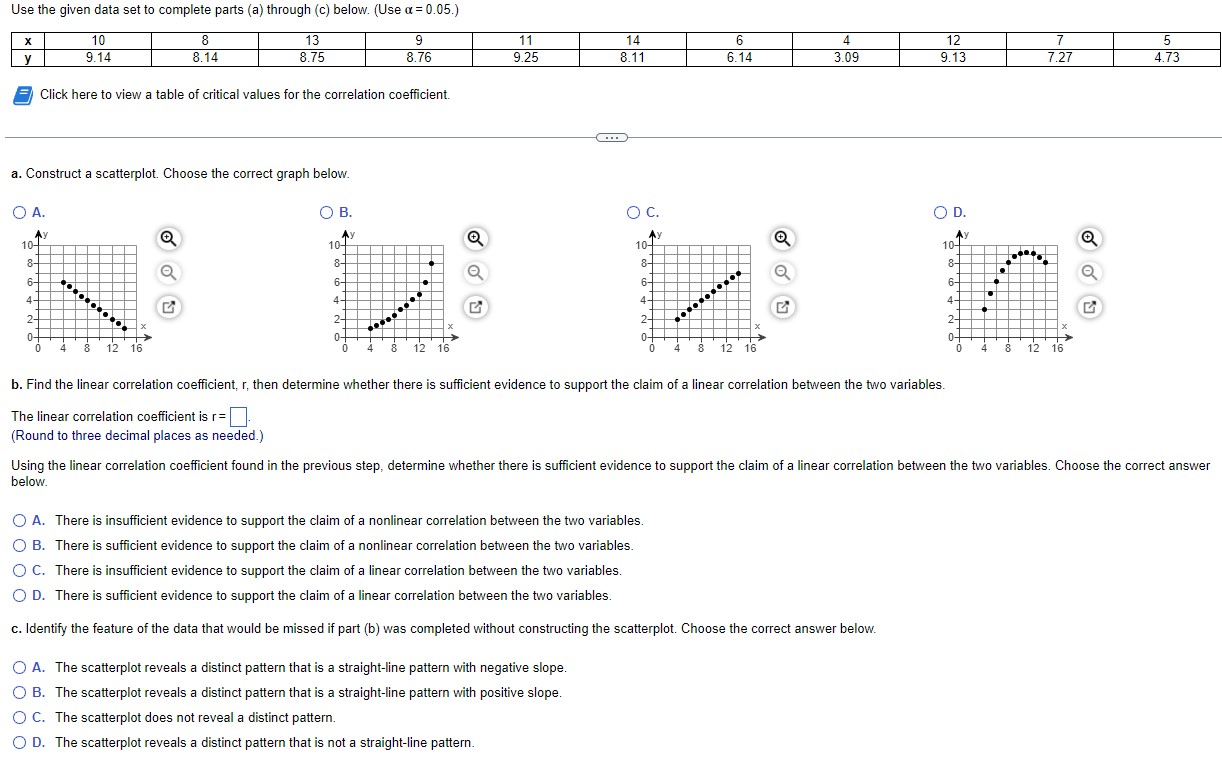
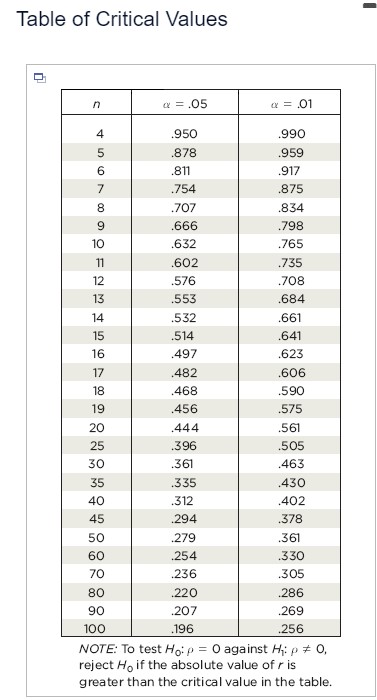
Use the given data set to complete parts (a) through (c) below. (Use a = 0.05.) X 10 8 13 9 11 14 6 4 12 7 5 9.14 8.14 8.75 8.76 9.25 8.11 6.14 3.09 9.13 7.27 4.73 Click here to view a table of critical values for the correlation coefficient. a. Construct a scatterplot. Choose the correct graph below. O A. O B. OC. OD. 10- 10 1y 8- 87 8- 6- 4 N N X 12 16 8 12 16 b. Find the linear correlation coefficient, r, then determine whether there is sufficient evidence to support the claim of a linear correlation between the two variables. The linear correlation coefficient is r=. (Round to three decimal places as needed.) Using the linear correlation coefficient found in the previous step, determine whether there is sufficient evidence to support the claim of a linear correlation between the two variables. Choose the correct answer below. O A. There is insufficient evidence to support the claim of a nonlinear correlation between the two variables. O B. There is sufficient evidence to support the claim of a nonlinear correlation between the two variables. O C. There is insufficient evidence to support the claim of a linear correlation between the two variables. O D. There is sufficient evidence to support the claim of a linear correlation between the two variables. c. Identify the feature of the data that would be missed if part (b) was completed without constructing the scatterplot. Choose the correct answer below. O A. The scatterplot reveals a distinct pattern that is a straight-line pattern with negative slope. O B. The scatterplot reveals a distinct pattern that is a straight-line pattern with positive slope. O C. The scatterplot does not reveal a distinct pattern. O D. The scatterplot reveals a distinct pattern that is not a straight-line pattern.Table of Critical Values n @ =.05 = .01 .950 .990 878 .959 .811 .917 .754 .875 .707 .834 .666 .798 .632 .765 .602 .735 12 .576 .708 13 .553 .684 14 .532 .661 15 .514 .641 16 .497 .623 17 .482 .606 18 468 .590 19 .456 .575 20 .444 .561 25 .396 .505 30 .361 .463 35 .335 .430 40 .312 .402 45 .294 .378 50 .279 .361 60 254 .330 70 .236 .305 80 .220 .286 90 .207 .269 100 .196 .256 NOTE: To test Hop = 0 against Hip # 0, reject Ho if the absolute value of / is greater than the critical value in the table
Step by Step Solution
There are 3 Steps involved in it

Get step-by-step solutions from verified subject matter experts