

Question: Use the given data set to complete parts (a) through (c) below. (Use a = 0.05.) X 10 8 13 9 11 14 6 4
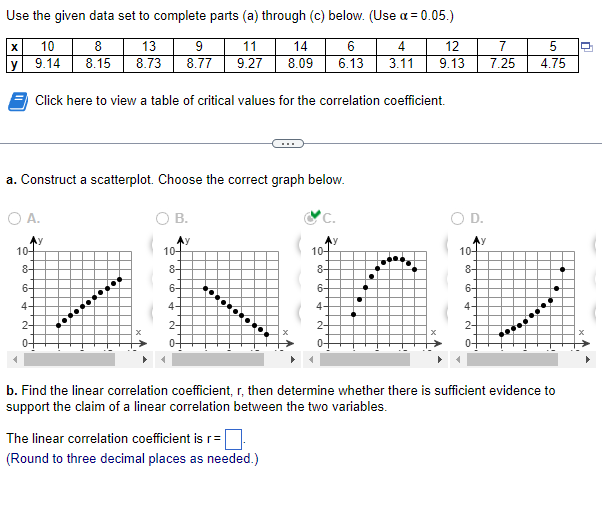


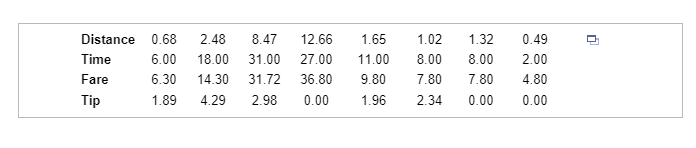


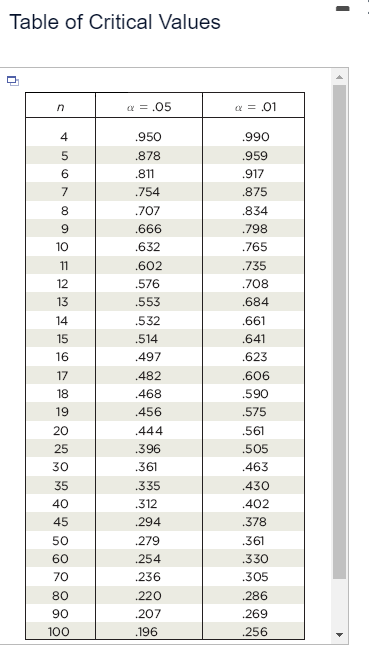
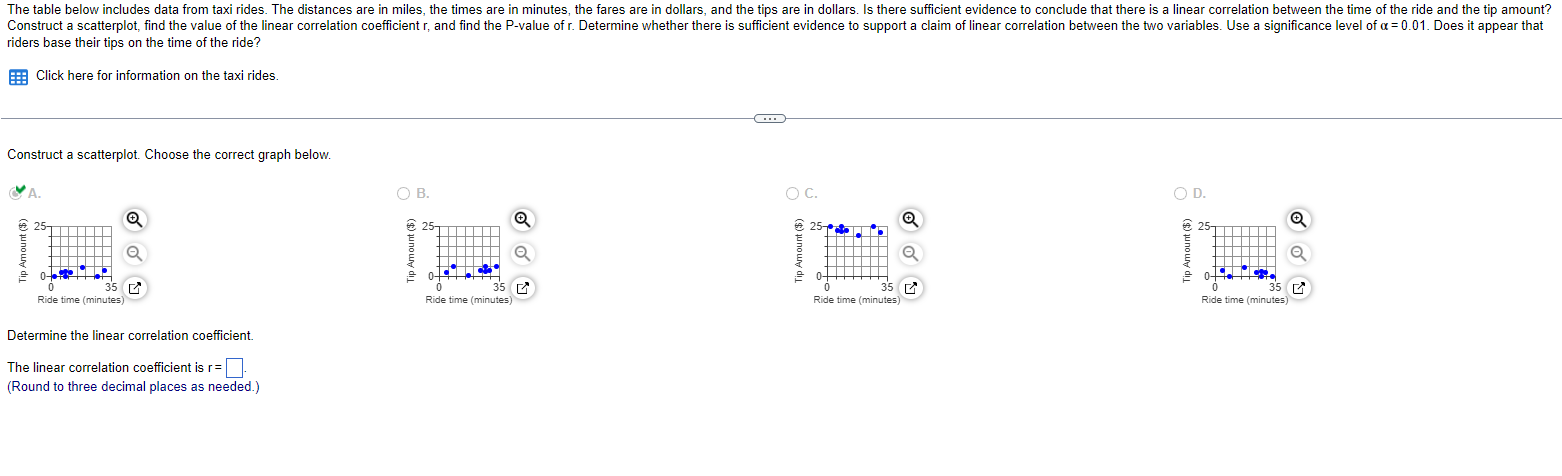

Use the given data set to complete parts (a) through (c) below. (Use a = 0.05.) X 10 8 13 9 11 14 6 4 9.14 12 7 V 8.15 5 8.73 8.77 9.27 8.09 6.13 3.11 9.13 7.25 4.75 Click here to view a table of critical values for the correlation coefficient. a. Construct a scatterplot. Choose the correct graph below. O A. O B. C. OD. 10 Ty 107y 10 Ty 8- 8- 8- 6- 6- 6- X X b. Find the linear correlation coefficient, r, then determine whether there is sufficient evidence to support the claim of a linear correlation between the two variables. The linear correlation coefficient is r= (Round to three decimal places as needed.)Table of Critical Values n @ =.05 ( = .01 .950 .990 .878 .959 .811 .917 .754 .875 8 .707 .834 .666 .798 10 .632 .765 11 .602 .735 12 .576 .708 13 .553 .684 14 .532 .661 15 .514 .641 16 .497 .623 17 482 .606 18 .468 .590 19 .456 .575 20 444 .561 25 .396 .505 30 .361 .463 35 .335 .430 40 .312 .402 45 294 .378 50 .279 .361 60 254 .330 70 .236 .305 80 .220 286 90 .207 .269 100 196 256The table below includes data from taxi rides. The distances are in miles, the times are in minutes, the fares are in dollars, and the tips are in dollars. Is there sufficient evidence to conclude that there is a linear correlation between the time of the ride and the tip amount? Construct a scatterplot, find the value of the linear correlation coefficient r, and find the P-value of r. Determine whether there is sufficient evidence to support a claim of linear correlation between the two variables. Use a significance level of
Step by Step Solution
There are 3 Steps involved in it

Get step-by-step solutions from verified subject matter experts