

Question: Use the given data to complete parts (a) and (b) below. 23 3.8 3.8 14 2.8 3.6 4.7 4.8 (a) Draw a scatter diagram of
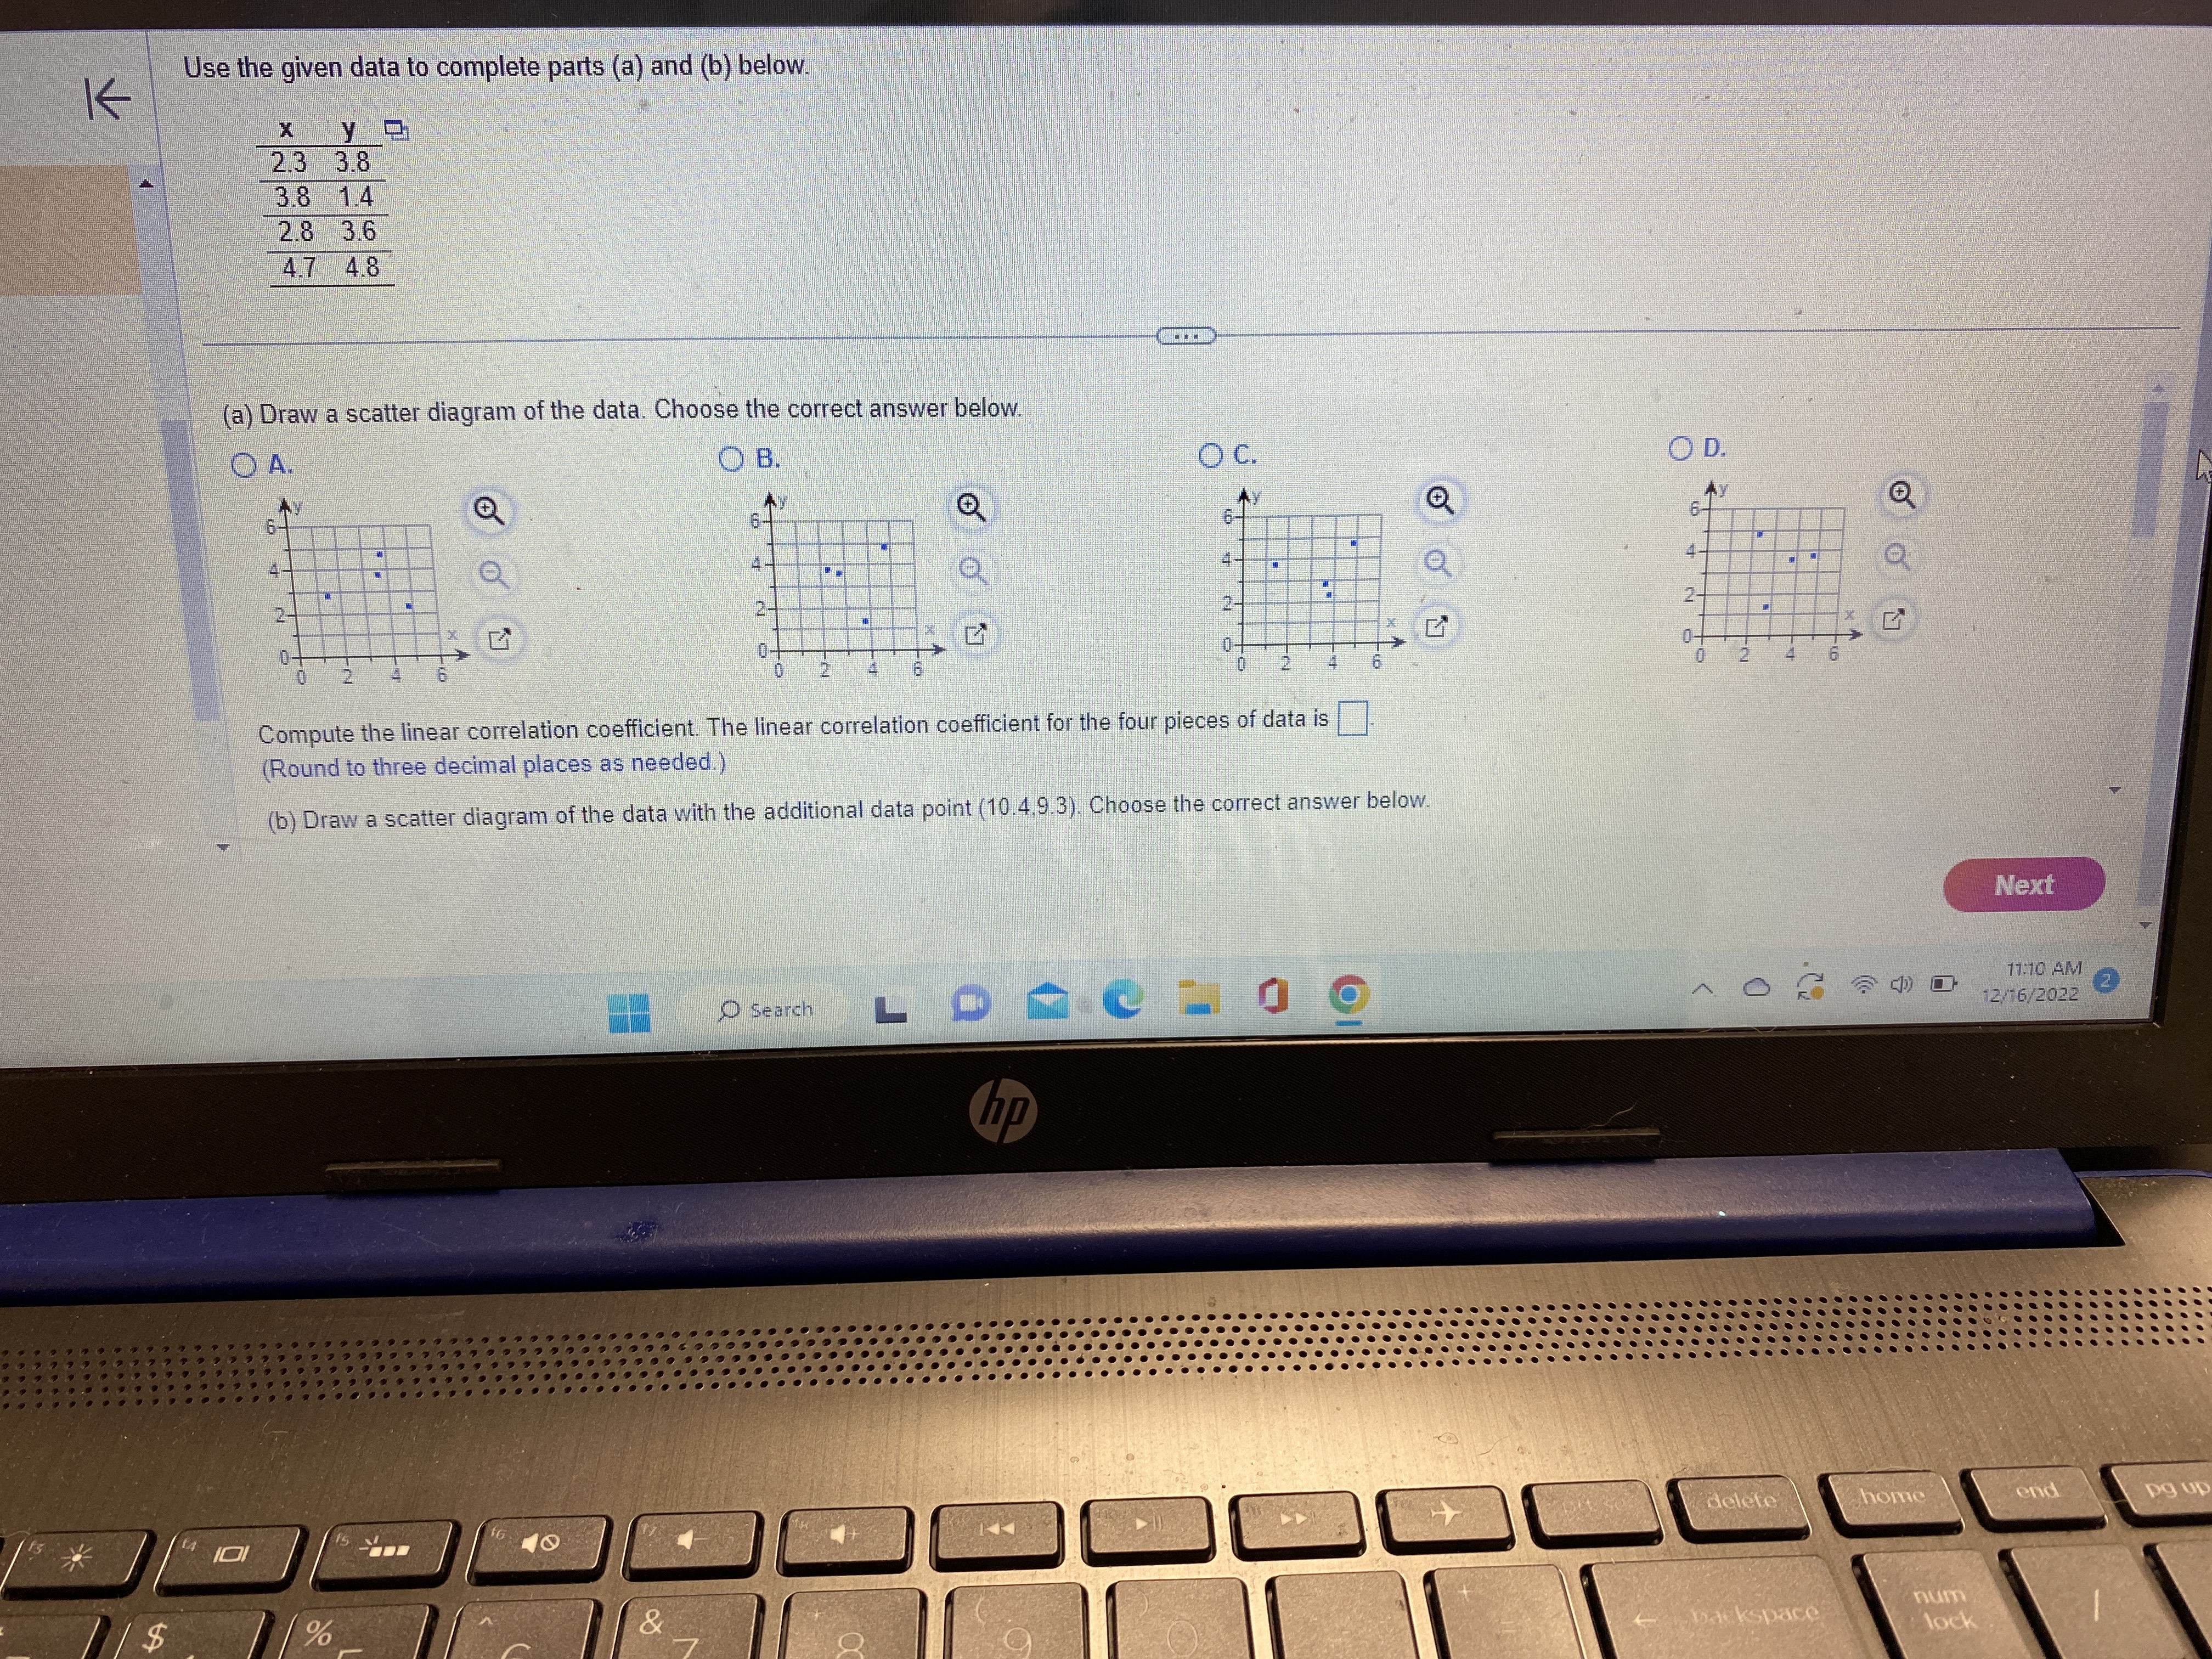


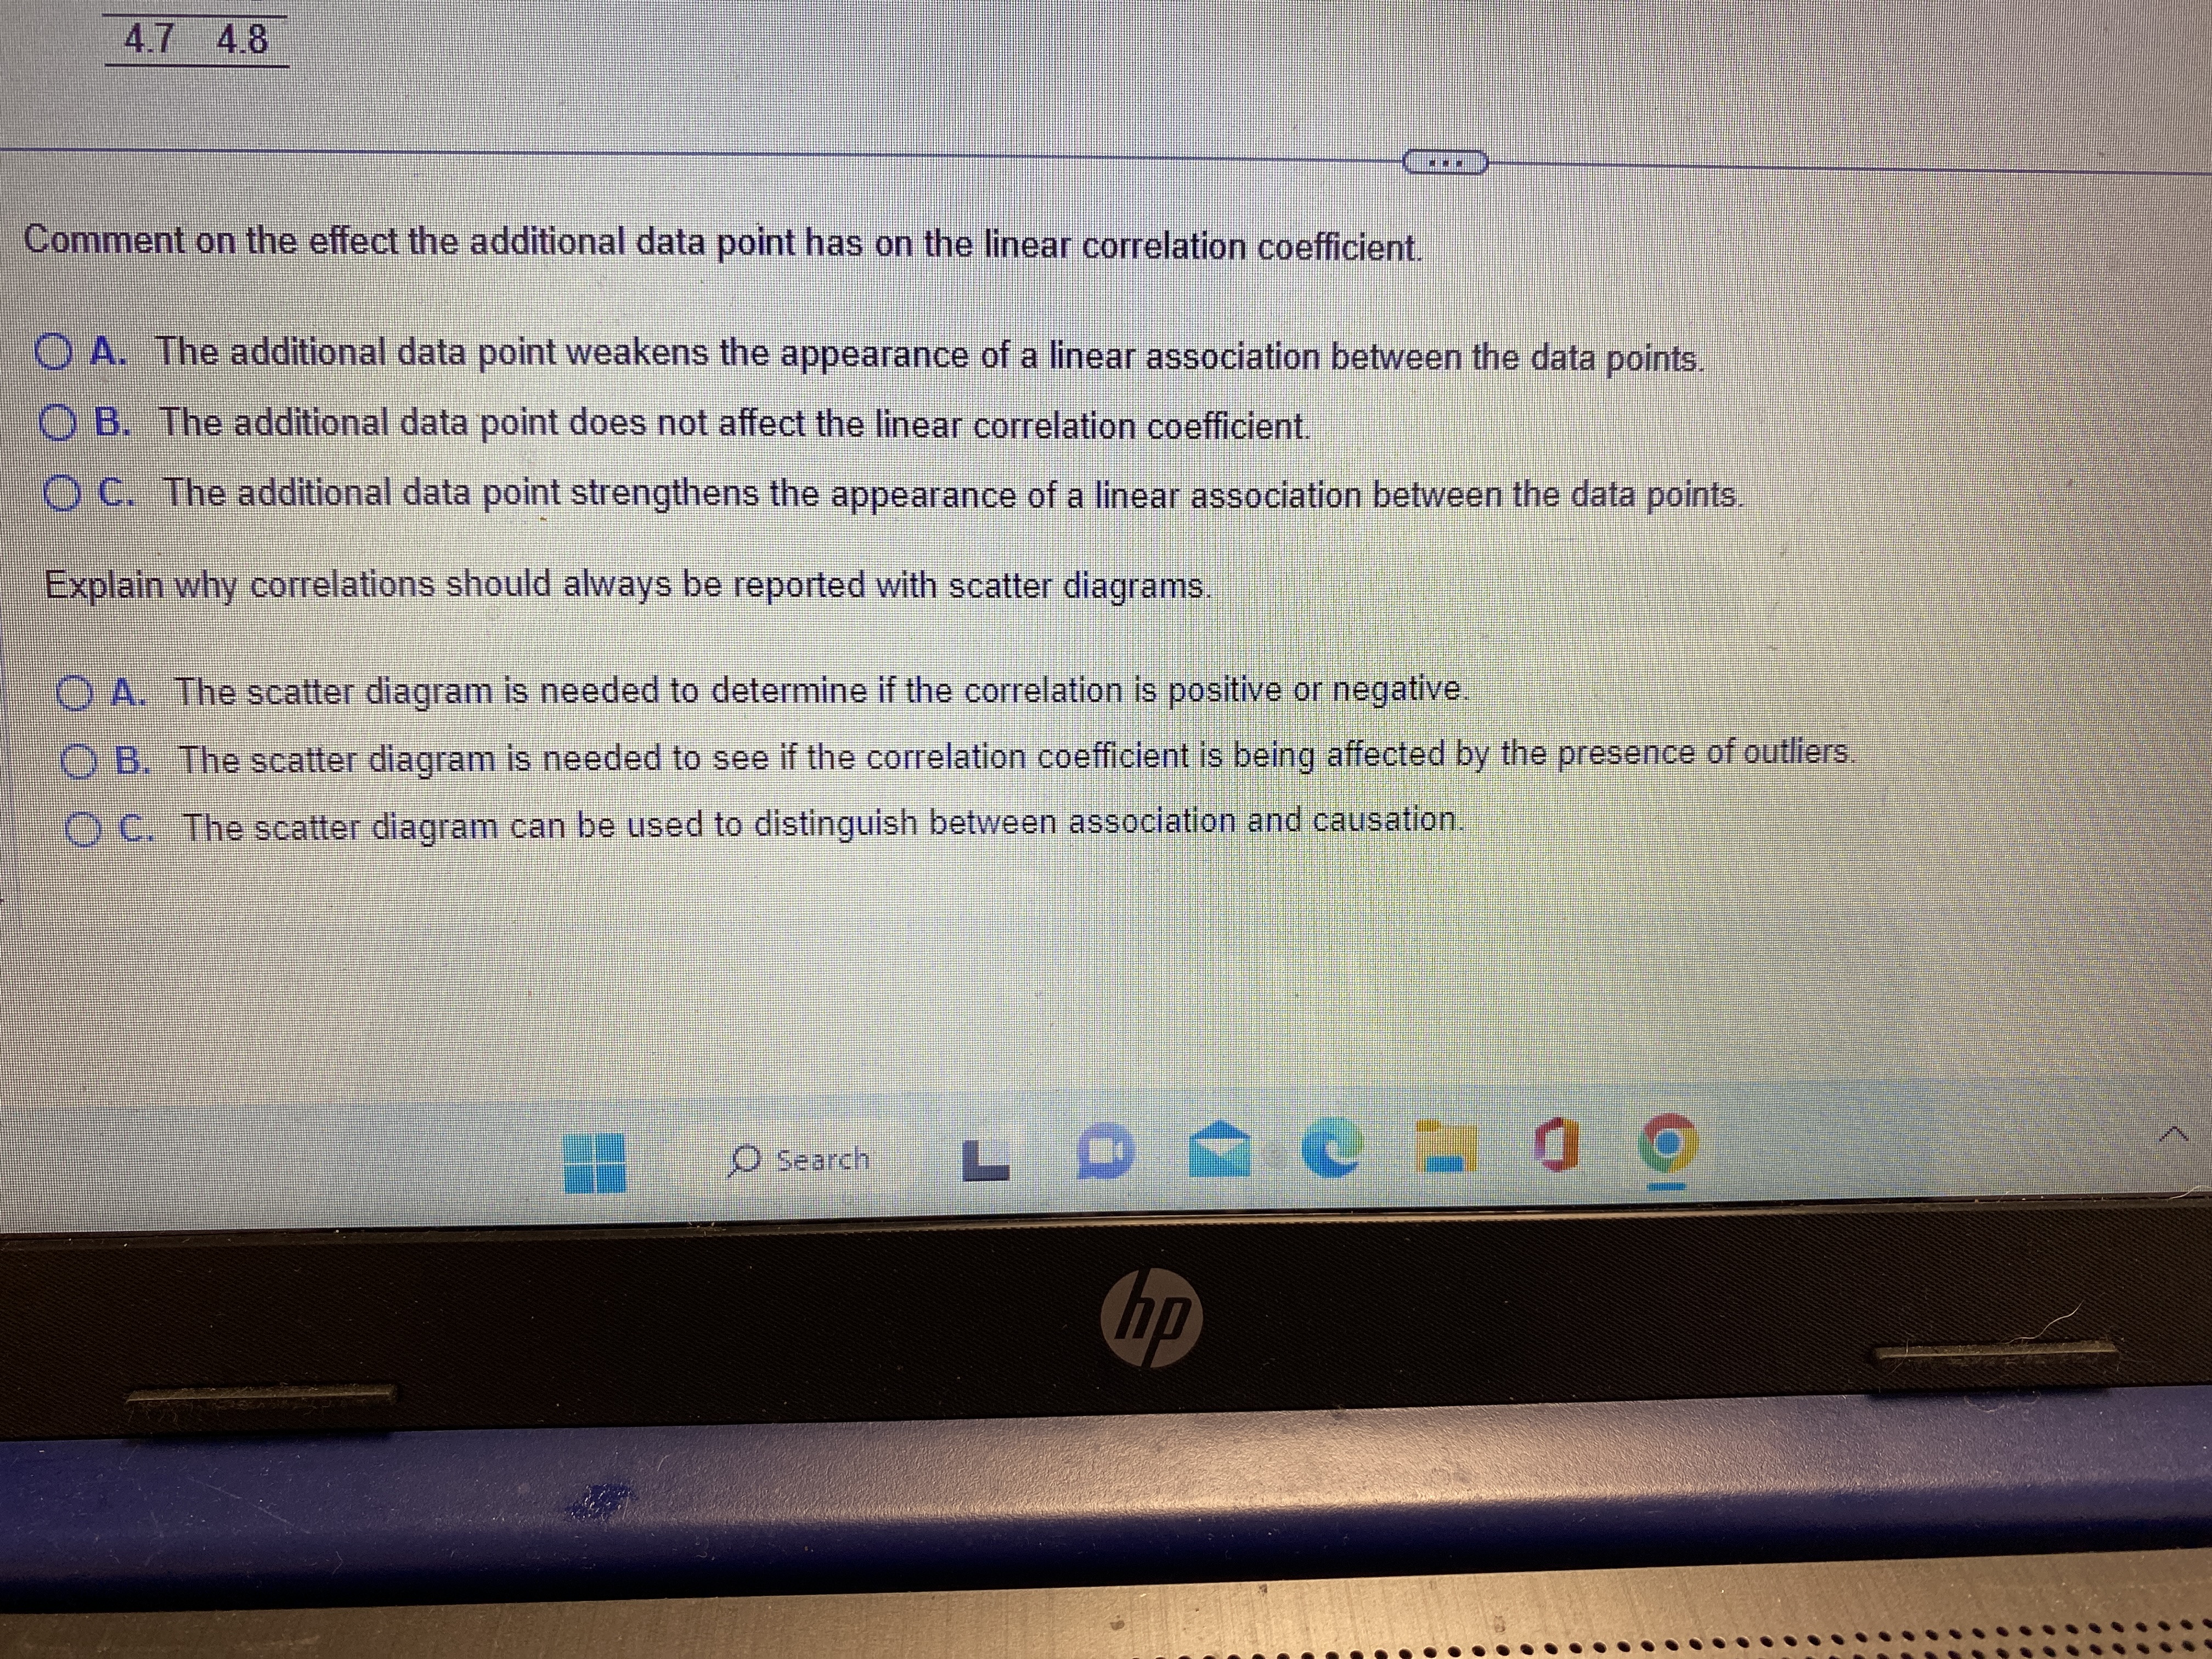
Use the given data to complete parts (a) and (b) below. 23 3.8 3.8 14 2.8 3.6 4.7 4.8 (a) Draw a scatter diagram of the data. Choose the correct answer below O A. O B. O C. O D. Compute the linear correlation coefficient. The linear correlation coefficient for the four pieces of data is (Round to three decimal places as needed.) b) Draw a scatter diagram of the data with the additional data point (10.4,9.3). Choose the correct answer below. Next O Search LOLCHOO 17:10 AM 12/16/2022 hp ... ...90 15 - delete home end 10 pg up & num space lockUse the given data to complete parts (a) and (b) below. 2.3 3.8 3.8 1.4 2.8 3.6 4.7 4.8 (b) Draw a scatter diagram of the data with the additional data point (10.4,9.3). Choose the correct answer below. O A. O B. O C. O D. 12- Ay 12- 8- 8- Q Compute the linear correlation coefficient with the additional data point. The linear correlation coefficient for the five pieces of data is (Round to three decimal places as needed.) Comment on the effect the additional data point has on the linear correlation coefficient. Osearch CL hp4.7 4.8 Comment on the effect the additional data point has on the linear correlation coefficient A. The additional data point weakens the appearance of a linear association between the data points. B. The additional data point does not affect the linear correlation coefficient. O C. The additional data point strengthens the appearance of a linear association between the data points. Explain why correlations should always be reported with scatter diagrams. O A. The scatter diagram is needed to determine if the correlation is positive or negative. O B. The scatter diagram is needed to see if the correlation coefficient is being affected by the presence of outliers. O C. The scatter diagram can be used to distinguish between association and causation. O Search hp
Step by Step Solution
There are 3 Steps involved in it

Get step-by-step solutions from verified subject matter experts