

Question: Use the given data to complete parts (a) and (b) below. 2.2 3.8 3.9 1.4 2.8 3.5 (a) Draw a scatter diagram of the data.

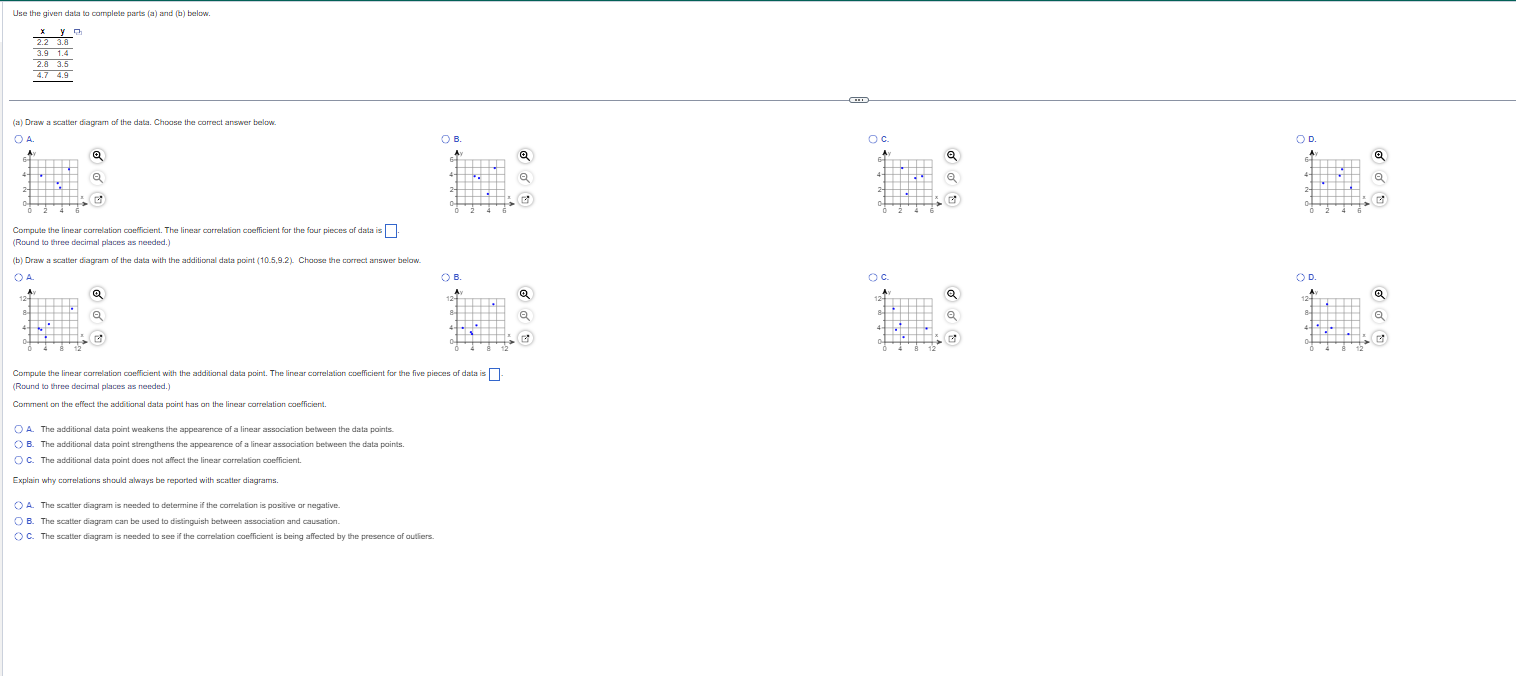
Use the given data to complete parts (a) and (b) below. 2.2 3.8 3.9 1.4 2.8 3.5 (a) Draw a scatter diagram of the data. Choose the correct answer below. OA B. O C. OD a O Compute the linear correlation coefficient. The linear correlation coefficient for the four pieces of data is . (Round to three decimal places as needed.) (b) Draw a scatter diagram of the data with the additional data point (10.5,9.2). Choose the correct answer below. A B. O c OD 12 O of Compute the linear correlation coefficient with the additional data point. The linear correlation coefficient for the five pieces of data is] (Round to three decimal places as needed.) Comment on the effect the additional data point has on the linear correlation coefficient. O A. The additional data point weakens the app rence of a linear association between the data points. () B. The additional data point strengthens the earence of a linear association between the data points. O C. The additional data point does not affect the linear correlation coefficient. Explain why correlations should always be repo red with scatter diagrams. O A. The scatter diagram is needed to d ve if the correlation is positive or negative. O B. The scatter diagram can be used to disfir on and cau ) C. The scatter diagram is needed to see if the correlation coefficient is being affected by the presence of outliers
Step by Step Solution
There are 3 Steps involved in it

Get step-by-step solutions from verified subject matter experts