

Question: Use the given data to do the following. ( a ) Find the regression equation for the data points. ( b ) Graph the regression
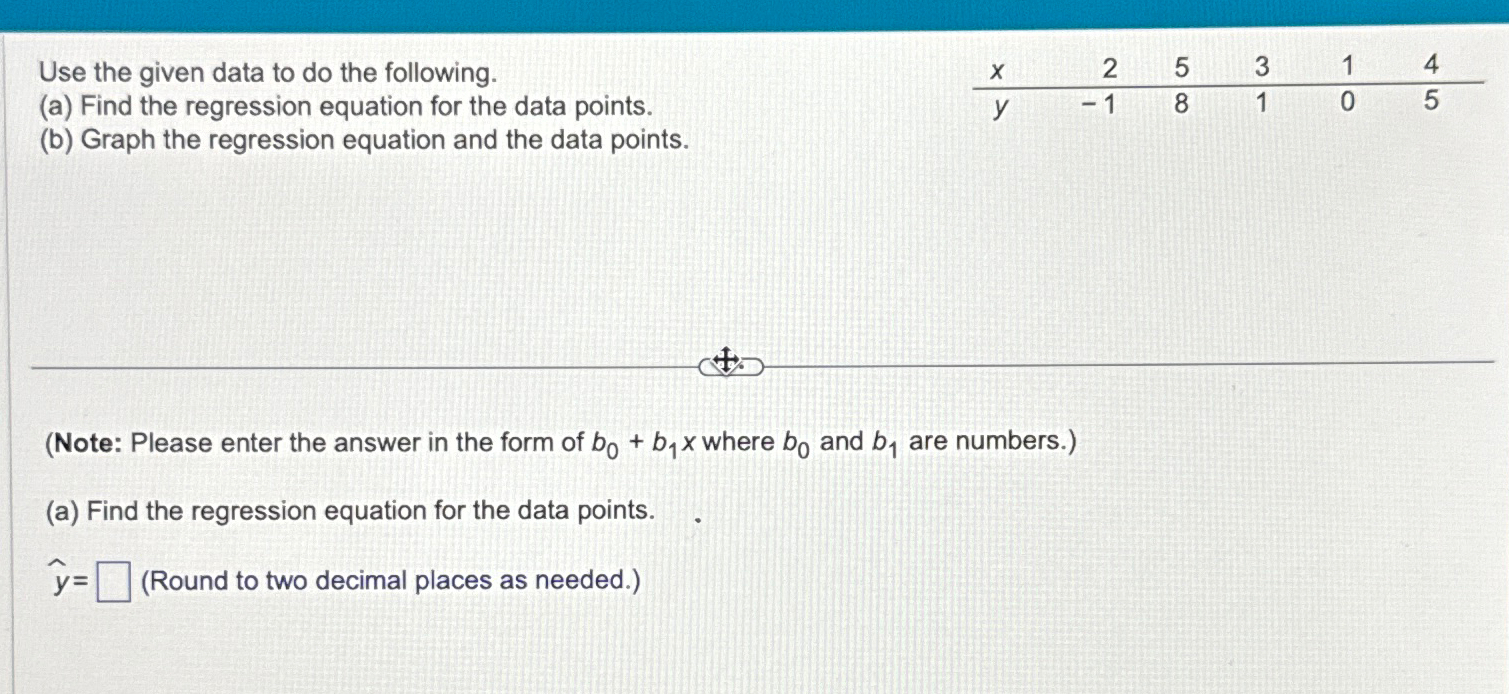
Use the given data to do the following.
a Find the regression equation for the data points.
b Graph the regression equation and the data points.
table
Note: Please enter the answer in the form of where and are numbers.
a Find the regression equation for the data points.
widehatRound to two decimal places as needed.
Step by Step Solution
There are 3 Steps involved in it
1 Expert Approved Answer
Step: 1 Unlock

Question Has Been Solved by an Expert!
Get step-by-step solutions from verified subject matter experts
Step: 2 Unlock
Step: 3 Unlock