

Question: Use the graph below for this Class Exerciseit illustrates a Consumer trying to Optimize the amount of Good X and Good Y they consume with

Use the graph below for this Class Exerciseit illustrates a Consumer trying to Optimize the amount of Good X and Good Y they consume with their limited budget. ICI and ICII are indifference curves. BL1 and BL2 are budget Lines
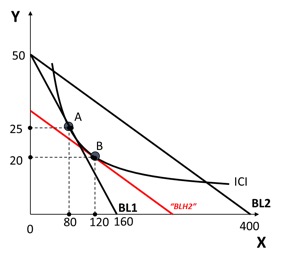
Y 50 A 25 B 20 ICI BL1 BL2 80 120 160 400 X
Step by Step Solution
There are 3 Steps involved in it
1 Expert Approved Answer
Step: 1 Unlock

Question Has Been Solved by an Expert!
Get step-by-step solutions from verified subject matter experts
Step: 2 Unlock
Step: 3 Unlock