

Question: Use the graph below to help you explain how the following event affects variables a through d: (2 points each) Event: Increase in productivity of


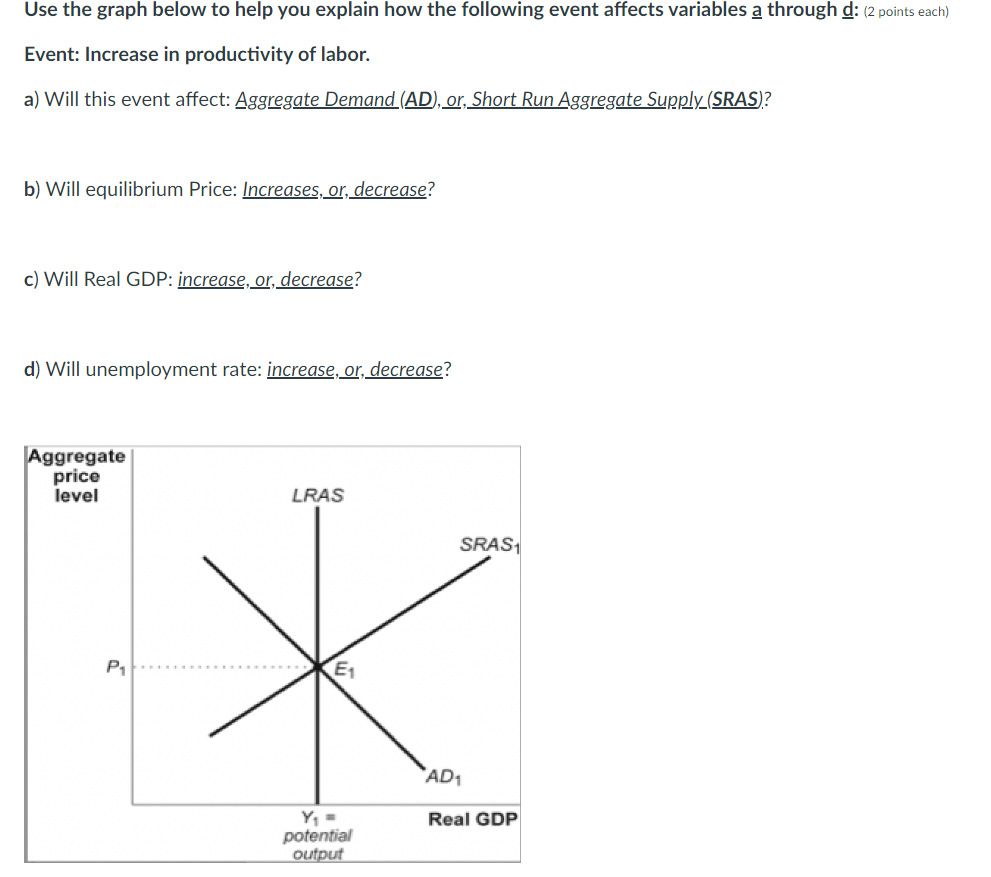

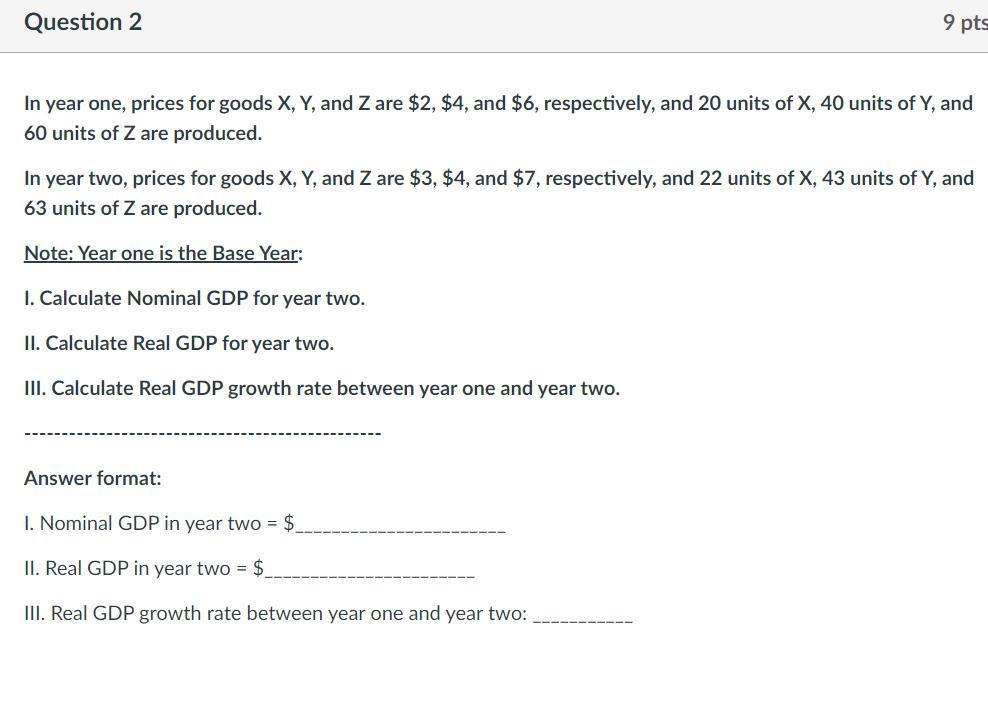
Use the graph below to help you explain how the following event affects variables a through d: (2 points each) Event: Increase in productivity of labor. a) Will this event affect: Aggregate Demand (AD), or, Short Run Aggregate Supply (SRAS)? b) Will equilibrium Price: Increases, or, decrease? c) Will Real GDP: increase, or, decrease? d) Will unemployment rate: increase, or, decrease? Aggregate price level LRAS SRAS P1 `AD1 Y, = Real GDP potential outputQuestion 1 Country A's civilian, non-institutional, population over 16 years of age is 202,500,000, of this number 120,100,000 are employed, and 10,125,000 are unemployed, of whom 6,025,000 are frictionally, and 4,050,000 are structurally unemployed. a) What is the size of the labor force? ................................................ b) What is the Structural Unemployment ? c} What is the actual unemployment ? d} What is the Natural m of Unemployment (NRU)? e) What is the Cyclical unemployment ? fl Is the economy in a recession, boom, or full employment? 3) Explain your answer to part f: Question 2 9 pts In year one, prices for goods X, Y, and Z are $2, $4, and $6, respectively, and 20 units of X, 40 units of Y, and 60 units of Z are produced. In year two, prices for goods X, Y, and Z are $3, $4, and $7, respectively, and 22 units of X, 43 units of Y, and 63 units of Z are produced. Note: Year one is the Base Year: I. Calculate Nominal GDP for year two. N. Calculate Real GDP for year two. I\". Calculate Real GDP growth rate between year one and year two. Answer format: I. Nominal GDP in year two = $_______________________ II. Real GDP in yeartwo = $ _______________________ |||. Real GDP growth rate between year one and year two
Step by Step Solution
There are 3 Steps involved in it

Get step-by-step solutions from verified subject matter experts