

Question: Use the graph below to help you explain how the following event affects variables a through d: (2 points each) Event: Increase in productivity of
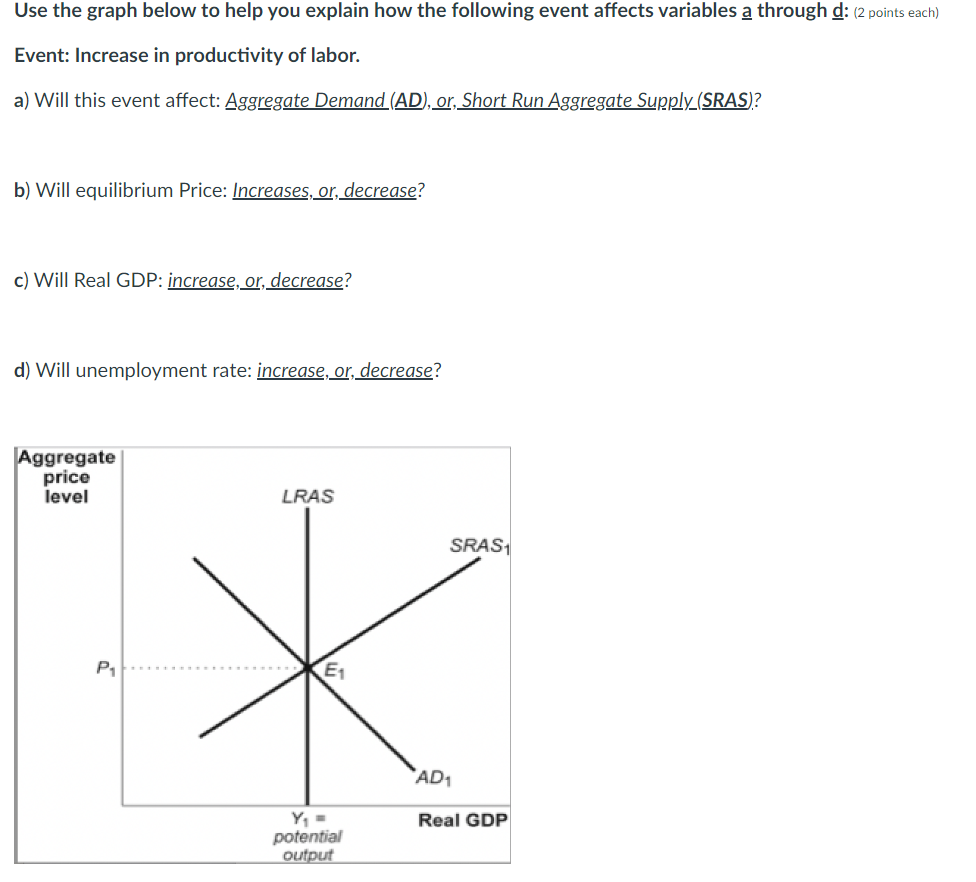
Use the graph below to help you explain how the following event affects variables a through d: (2 points each) Event: Increase in productivity of labor. a) Will this event affect: Aggregate Demand (AD), or, Short Run Aggregate Supply (SRAS)? b) Will equilibrium Price: Increases, or, decrease? c) Will Real GDP: increase, or, decrease? d) Will unemployment rate: increase, or, decrease? Aggregate price level LRAS SRAS1 P1 E1 AD Real GDP potential output
Step by Step Solution
There are 3 Steps involved in it
1 Expert Approved Answer
Step: 1 Unlock

Question Has Been Solved by an Expert!
Get step-by-step solutions from verified subject matter experts
Step: 2 Unlock
Step: 3 Unlock