

Question: Use the graph below to make a rough estimate for the slope m and the y-intercept b of the regression line for these points. Click
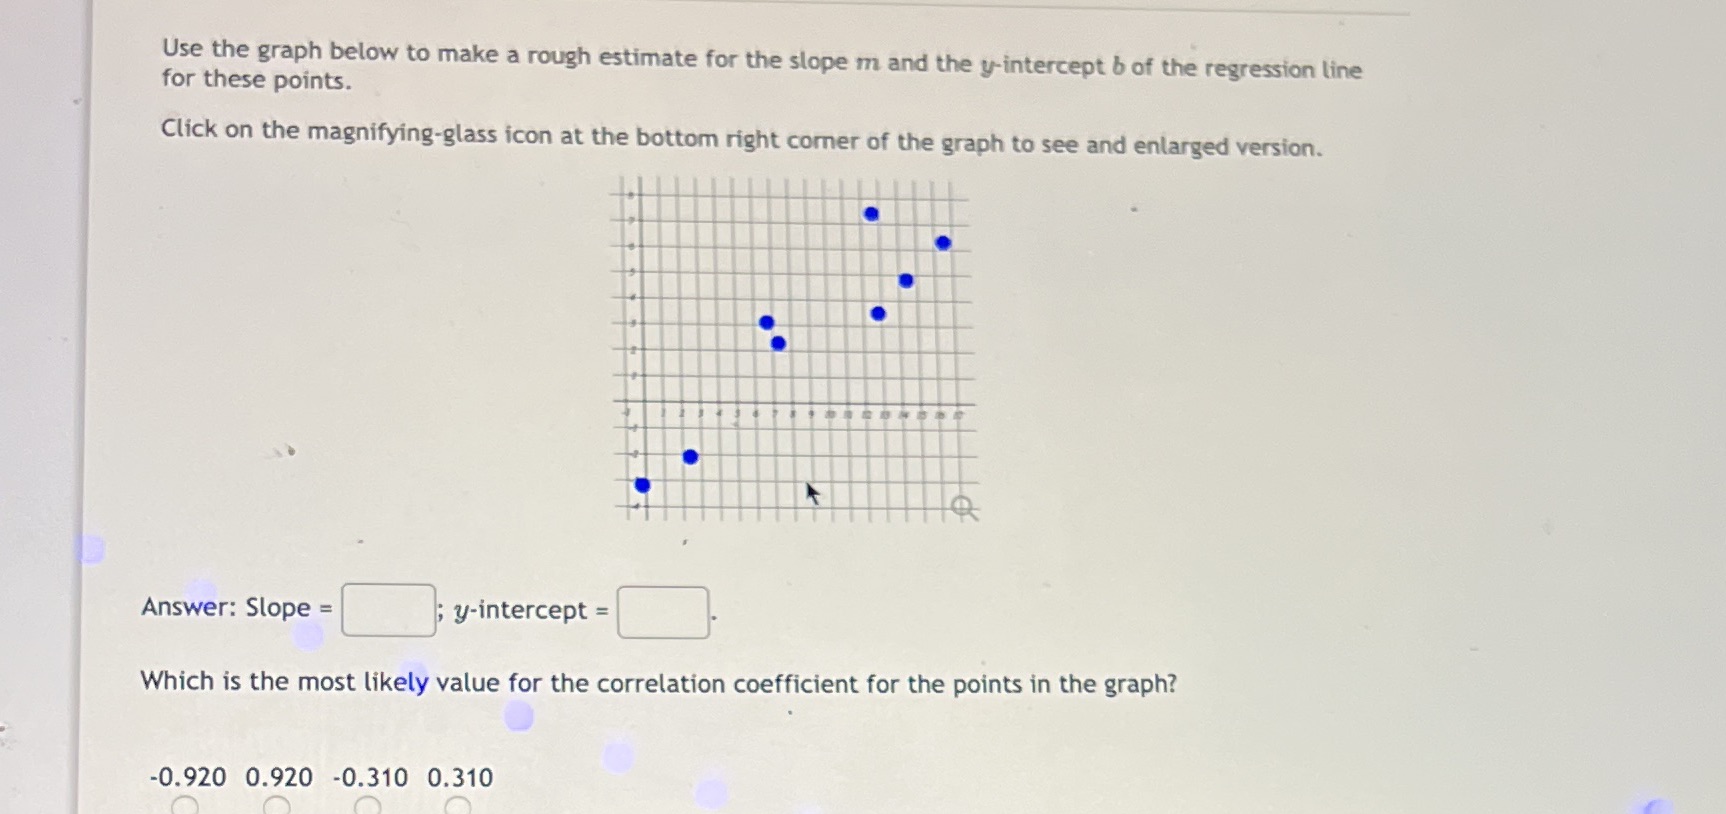
Use the graph below to make a rough estimate for the slope m and the y-intercept b of the regression line for these points. Click on the magnifying-glass icon at the bottom right corner of the graph to see and enlarged version. Answer: Slope = y-intercept = Which is the most likely value for the correlation coefficient for the points in the graph? -0.920 0.920 -0.310 0.310
Step by Step Solution
There are 3 Steps involved in it
1 Expert Approved Answer
Step: 1 Unlock

Question Has Been Solved by an Expert!
Get step-by-step solutions from verified subject matter experts
Step: 2 Unlock
Step: 3 Unlock