

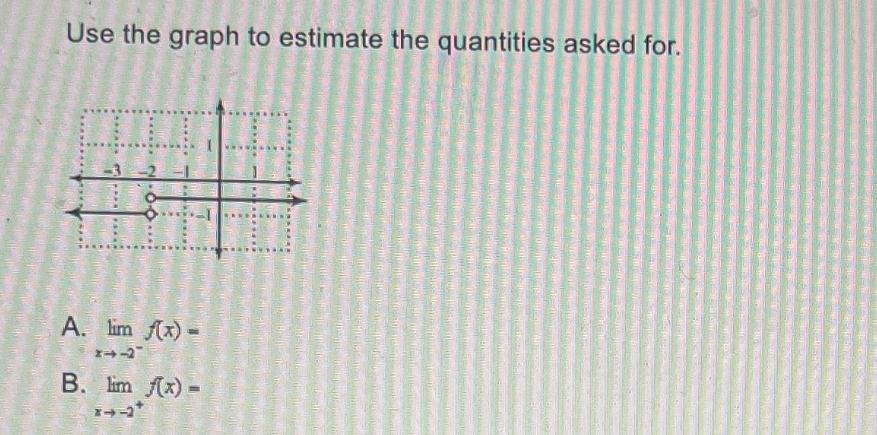
Question: Use the graph to estimate the quantities asked for. A. lim f(x)= B. lim f(x) *+-2* Exhibit 3-2 Use the information in the following

Use the graph to estimate the quantities asked for. A. lim f(x)= B. lim f(x) *+-2* Exhibit 3-2 Use the information in the following table to answer the question(s). W(0) 4 10 8 17 12 16 20 24 28 33 35 31 26 30 Refer to Exhibit 3-2. Compute the average rate of change from:-4 minutes to 1-12 minutes.
Step by Step Solution
There are 3 Steps involved in it
1 Expert Approved Answer
Step: 1 Unlock

Question Has Been Solved by an Expert!
Get step-by-step solutions from verified subject matter experts
Step: 2 Unlock
Step: 3 Unlock