

Question: Use the graphs from below to help answer question 4. Top Graph: Total Capital over time based on different savings rates (A,B,C) Bottom Graph: Human
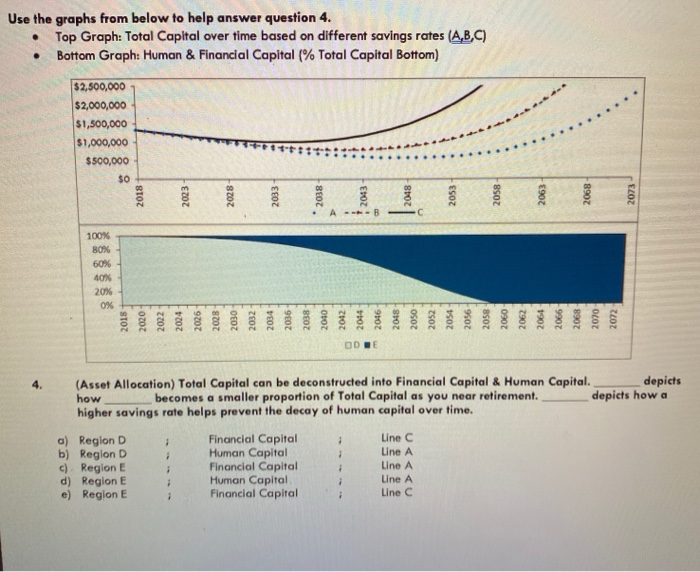
Use the graphs from below to help answer question 4. Top Graph: Total Capital over time based on different savings rates (A,B,C) Bottom Graph: Human & Financial Capital (% Total Capital Bottom) $2,500,000 $2,000,000 $1,500,000 $1,000,000 $500,000 2018+ EZOZ 2028 EEOZ 2018 2048 2053 2058 2068 100% 80% 60% 40% 20% 0% 2018 Foroz 2022 2024 2026 2028 2030 2032 2034 2036 2040 2018 2050 2052 2054 9507 2058 2060 2062 2064 2066 2068 2070 2072 (Asset Allocation) Total Capital can be deconstructed into Financial Capital & Human Capital depicts becomes a smaller proportion of Total Capital as you near retirement. depicts how a higher savings rote helps prevent the decay of human capital over time. a) Region D b) Region D c) Region E d) Region E e) Region E Financial Capital Human Capital Financial Capital Human Capital Financial Capital Line C Une A Line A Line A Line C
Step by Step Solution
There are 3 Steps involved in it

Get step-by-step solutions from verified subject matter experts