

Question: Use the handout that we covered in class to work this quiz. You have been given two different investments: Stock X and Stock Y. The
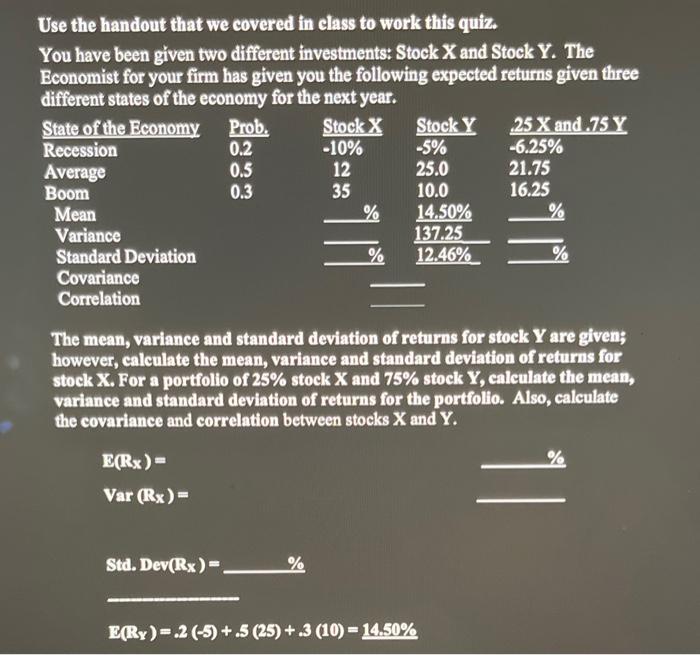
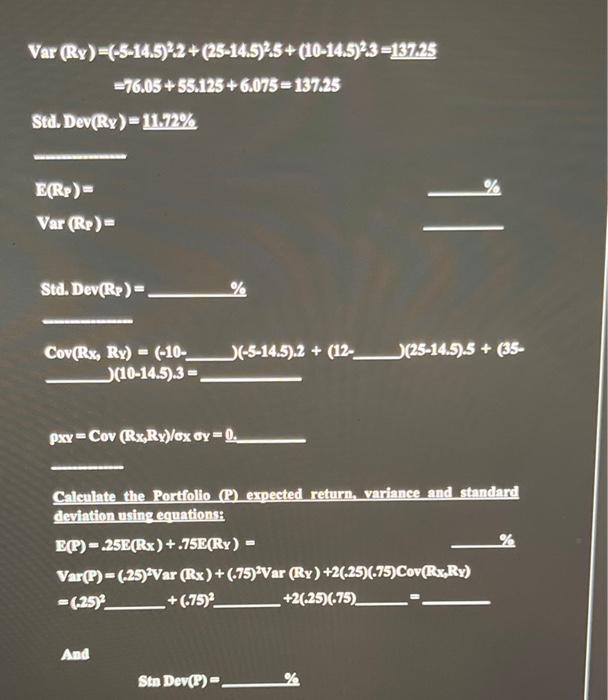
Use the handout that we covered in class to work this quiz. You have been given two different investments: Stock X and Stock Y. The Economist for your firm has given you the following expected returns given three different states of the economy for the next year. State of the Economy Prob. Stock X Stock Y 25 X and .75 Y Recession 0.2 -10% -5% -6.25% Average 0.5 12 25.0 21.75 Boom 0.3 35 10.0 16.25 Mean % 14.50% Variance 137.25 Standard Deviation % 12.46% Covariance Correlation The mean, variance and standard deviation of returns for stock Y are given; however, calculate the mean, variance and standard deviation of returns for stock X. For a portfolio of 25% stock X and 75% stock Y, calculate the mean, variance and standard deviation of returns for the portfolio. Also, calculate the covariance and correlation between stocks X and Y. E(Rx) - % Var (Rx) - Std. Dev(Rx)= % E(Ry)=.2 (-5)+.5 (25) + 3 (10) - 14.50% Var (Ry)-(-5-14.5)2.2 + (25-14.5)2.5+ (10-14.5)23=137.25 =76.05 + 55.125 +6.075= 137.25 Std. Dev(Ry) - 11.72% E(RP) - Var (Rp) 11 Std. Dev(RP) - % (-5-14.5).2 + (12- (25-14.57.5+ (35- Cov(Rx, Ry) - (-10- (10-14.5).3 Pxy Cov (RxRx)/x Gy=0. Calculate the Portfolio P) expected return, variance and standard deviation using equations: EP)-25E(Rx) + .75E(RY) - Var(P)-(-25)Var (Rx)+(-75) Var (Ry) +2(-25)(-75)Cov(Rx,Ry) =(-25) -+(-75) +2.25)(.75) And Sto Dev(P) - %
Step by Step Solution
There are 3 Steps involved in it

Get step-by-step solutions from verified subject matter experts