

Question: Use the high-low method and the data in the table below to estimate the variable cost per machine hour for utilities. Month January February March
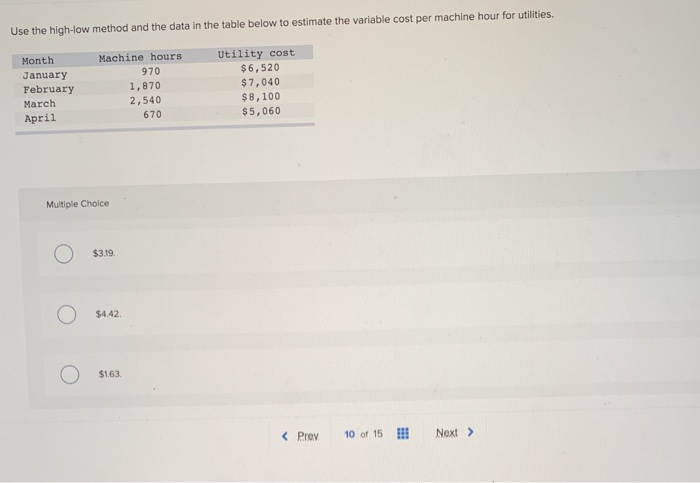
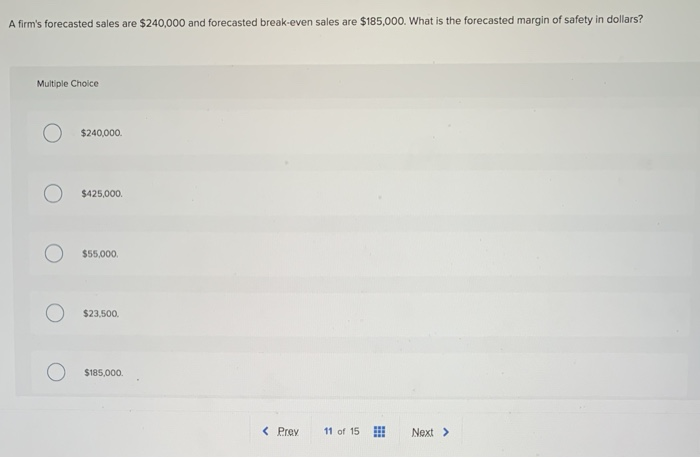
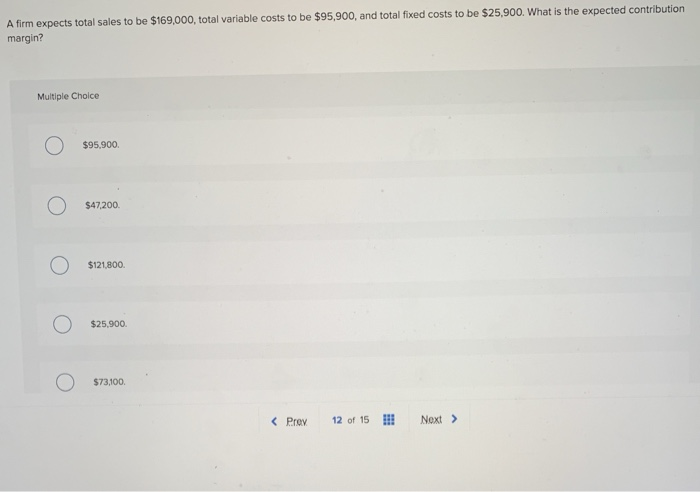
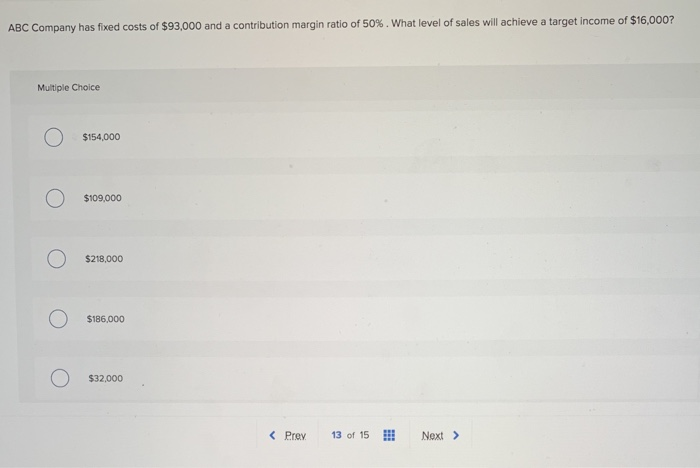
Use the high-low method and the data in the table below to estimate the variable cost per machine hour for utilities. Month January February March April Machine hours 970 1,870 2,540 670 Utility cost $6,520 $7,040 $8,100 $5,060 Multiple Choice $3.19 $4,42 $163 A firm's forecasted sales are $240,000 and forecasted break-even sales are $185,000. What is the forecasted margin of safety in dollars? Multiple Choice $240,000 $425,000 $55,000 $23.500 $185,000 A firm expects total sales to be $169,000, total variable costs to be $95,900, and total fixed costs to be $25,900. What is the expected contribution margin? Multiple Choice $95.900. $47,200 $121,800. $25.900 $73,100 ABC Company has fixed costs of $93,000 and a contribution margin ratio of 50%. What level of sales will achieve a target Income of $16,000? Multiple Choice $154,000 $109,000 $218,000 $186,000 $32,000
Step by Step Solution
There are 3 Steps involved in it

Get step-by-step solutions from verified subject matter experts