

Question: Use the Histogram tool to construct frequency distributions and histograms for weekly usage and waiting time for the data below. Do not group the data
Use the Histogram tool to construct frequency distributions and histograms for weekly usage and waiting time for the data below. Do not group the data into bins.
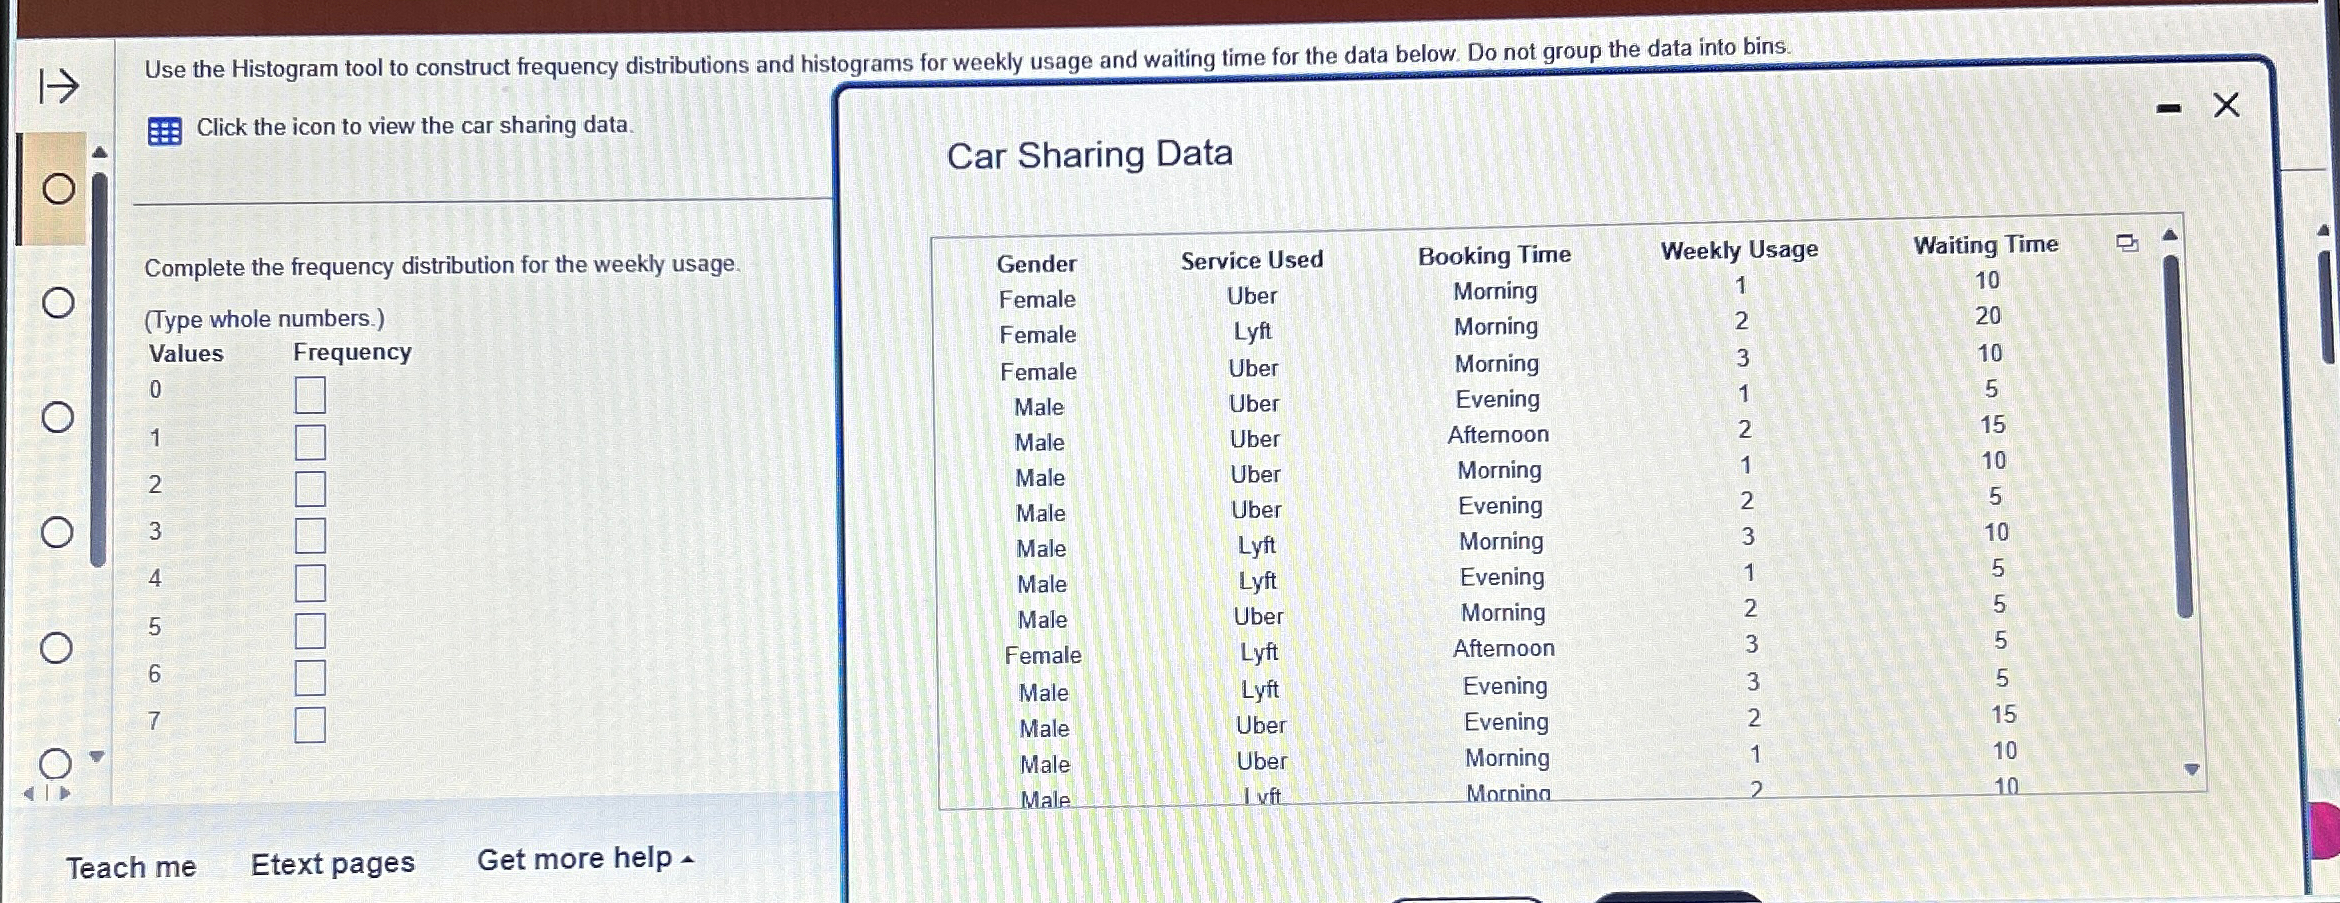
Click the icon to view the car sharing data.
Complete the frequency distribution for the weekly usage.
Type whole numbers.
Values Frequency
Car Sharing Data
tableGenderService Used,Booking Time,Weekly Usage,Waiting TimeFemaleUber,Morning,FemaleLyftMorning,FemaleUber,Morning,MaleUber,Evening,MaleUber,Afternoon,MaleUber,Morning,MaleUber,Evening,MaleLyftMorning,MaleLyftEvening,MaleUber,Morning,FemaleLyftAfternoon,MaleLyftEvening,MaleUber,Evening,MaleUber,Morning,MaleI vit,Mornina,
Teach me Etext pages Get more help
Step by Step Solution
There are 3 Steps involved in it
1 Expert Approved Answer
Step: 1 Unlock

Question Has Been Solved by an Expert!
Get step-by-step solutions from verified subject matter experts
Step: 2 Unlock
Step: 3 Unlock