

Question: Use the Histogram tool to construct frequency distributions and histograms for weekly usage and waiting time for the data below. Do not group the data
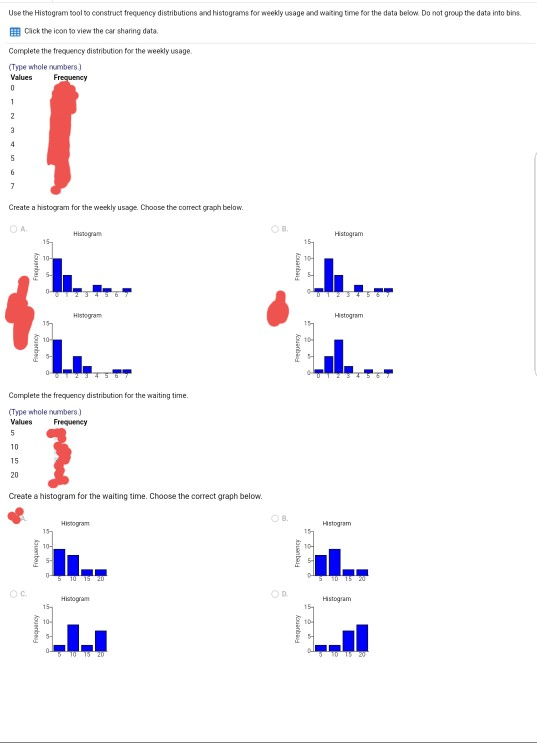
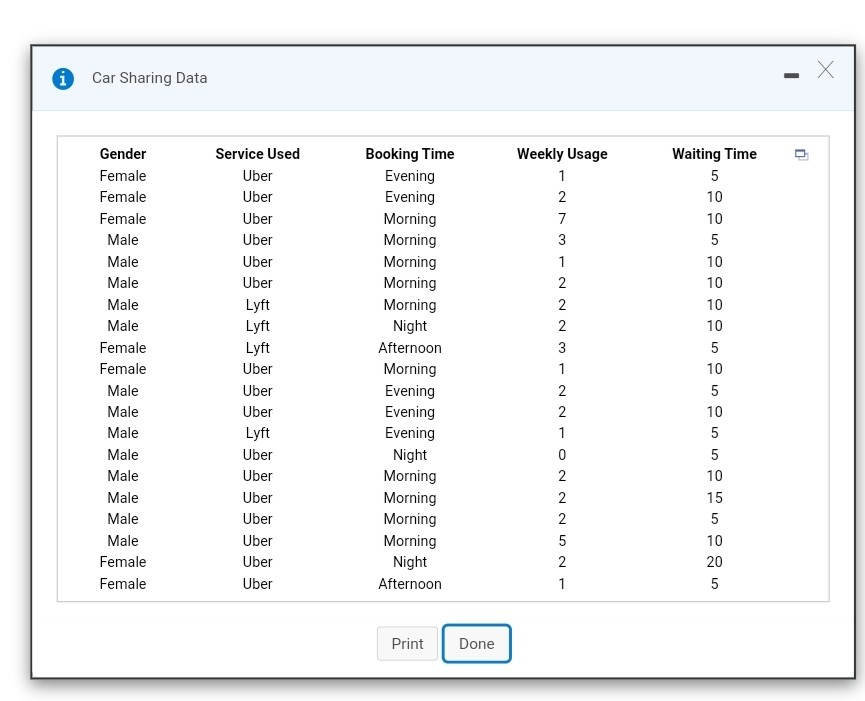
Use the Histogram tool to construct frequency distributions and histograms for weekly usage and waiting time for the data below. Do not group the data into bins. Click the icon to view the car sharing data Complete the frequency distribution for the weekly usage (Type whole numbers Frequency 0 1 2 3 Values 4 5 6 7 Create a histogram for the weekly usage. Choose the correct graph below. Histogram Histogram 10- Frequency Frequency Histogram Histogram 10 Frequency L. Prequency Complete the frequency distribution for the waiting time. (Type whole numbers) Values Frequency 5 10 15 20 } Create a histogram for the waiting time. Choose the correct graph below. Histogram Histogram 10- 104 Frequency Frequency 5 10 15 20 OG Histogram Histogram 15- 10- Frequency Frequency i Car Sharing Data X Gender Female Female Female Male Male Male Male Male Female Female Male Male Male Male Male Male Male Male Female Female Service Used Uber Uber Uber Uber Uber Uber Lyft Lyft Lyft Uber Uber Uber Lyft Uber Uber Uber Uber Uber Uber Uber Booking Time Evening Evening Morning Morning Morning Morning Morning Night Afternoon Morning Evening Evening Evening Night Morning Morning Morning Morning Night Afternoon Weekly Usage 1 2 7 3 1 2 2 2 3 1 2 2 1 0 2 2 2 5 2 1 Waiting Time 5 10 10 5 10 10 10 10 5 10 5 10 5 5 10 15 5 10 20 5 Print Done
Step by Step Solution
There are 3 Steps involved in it
1 Expert Approved Answer
Step: 1 Unlock

Question Has Been Solved by an Expert!
Get step-by-step solutions from verified subject matter experts
Step: 2 Unlock
Step: 3 Unlock