

Question: Use the horizontal analysis of the data below to indicate any potential red flags regarding possible overstatement of sales. JA A B C D E
Use the horizontal analysis of the data below to indicate any potential red flags regarding possible overstatement of sales.
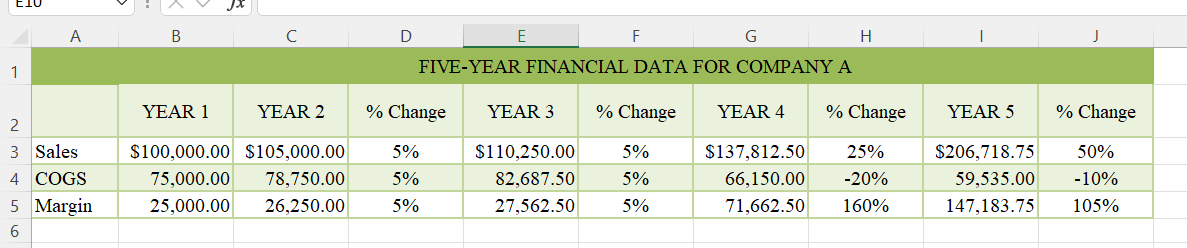
JA A B C D E F G H FIVE-YEAR FINANCIAL DATA FOR COMPANY A YEAR 1 YEAR 2 % Change YEAR 3 % Change YEAR 4 % Change YEAR 5 % Change 3 Sales $100,000.00 $105,000.00 5% $110,250.00 5% $137,812.50 25% $206,718.75 50% 4 COGS 75,000.00 78,750.00 5% 82,687.50 5% 66,150.00 -20% 59,535.00 -10% 5 Margin 25,000.00 26,250.00 5% 27,562.50 5% 71,662.50 160% 147,183.75 105% 6
Step by Step Solution
There are 3 Steps involved in it
1 Expert Approved Answer
Step: 1 Unlock

Question Has Been Solved by an Expert!
Get step-by-step solutions from verified subject matter experts
Step: 2 Unlock
Step: 3 Unlock