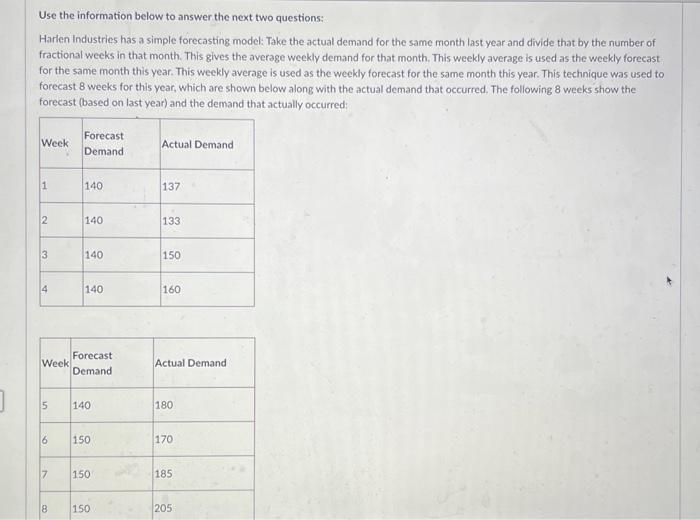
Question: Use the information below to answer the next two questions: Harlen Industries has a simple forecasting model: Take the actual demand for the same month

Use the information below to answer the next two
Use the information below to answer the next two questions: Harlen Industries has a simple forecasting model: Take the actual demand for the same month last year and divide that by the number of fractional weeks in that month. This gives the average weekly demand for that month. This weekly average is used as the weekly forecast for the same month this year. This weekly average is used as the weekly forecast for the same month this year. This technique was used to forecast 8 weeks for this year, which are shown below along with the actual demand that occurred. The following 8 weeks show the forecast (based on last year) and the demand that actually occurred: A company manufactures two products X and Y. Each product has to be processed in three departments: welding, assembly and painting. Each unit of X spends 2 hours in the welding department, 3 hours in assembly and 1 hour in painting. The corresponding fimes for a unit of Y are 3 hours in the welding department, 2 hours in assembly and 1 hour in painting. The employee hours available in a month are 1,500 for the welding department, 1.500 in assembly and 550 in painting. The contribution to profits are $100 for product X and $120 for product Y. What is the equation of the labor (or capacity) constraint for the welding department in this linear program? 2X+3Y1,500hours3X+2Y1,500hours3X+2Y550hours2X+3Y1,500hours Use the information below to answer the next two questions: Harlen Industries has a simple forecasting model: Take the actual demand for the same month last year and divide that by the number of fractional weeks in that month. This gives the average weekly demand for that month. This weekly average is used as the weekly forecast for the same month this year. This weekly average is used as the weekly forecast for the same month this year. This technique was used to forecast 8 weeks for this year, which are shown below along with the actual demand that occurred. The following 8 weeks show the forecast (based on last year) and the demand that actually occurred: A company manufactures two products X and Y. Each product has to be processed in three departments: welding, assembly and painting. Each unit of X spends 2 hours in the welding department, 3 hours in assembly and 1 hour in painting. The corresponding fimes for a unit of Y are 3 hours in the welding department, 2 hours in assembly and 1 hour in painting. The employee hours available in a month are 1,500 for the welding department, 1.500 in assembly and 550 in painting. The contribution to profits are $100 for product X and $120 for product Y. What is the equation of the labor (or capacity) constraint for the welding department in this linear program? 2X+3Y1,500hours3X+2Y1,500hours3X+2Y550hours2X+3Y1,500hours

Step by Step Solution

There are 3 Steps involved in it

1 Expert Approved Answer
Step: 1 Unlock blur-text-image
Question Has Been Solved by an Expert!

Get step-by-step solutions from verified subject matter experts

Step: 2 Unlock
Step: 3 Unlock

Students Have Also Explored These Related General Management Questions!