

Question: Use the information contained below to create a network diagram. Then compress one-time unit per move using the least cost method. Reduce the schedule until
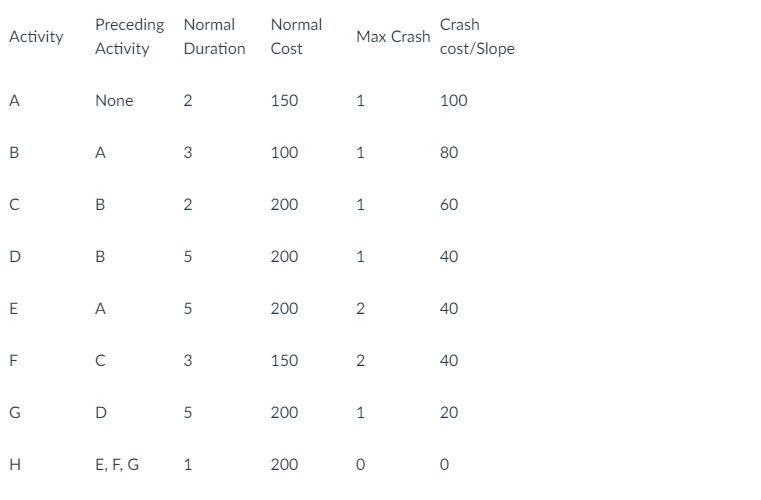
Use the information contained below to create a network diagram. Then compress one-time unit per move using the least cost method. Reduce the schedule until you reach the crash point of the network. For each move identify what activity(ies) was crashed and the adjusted total cost.
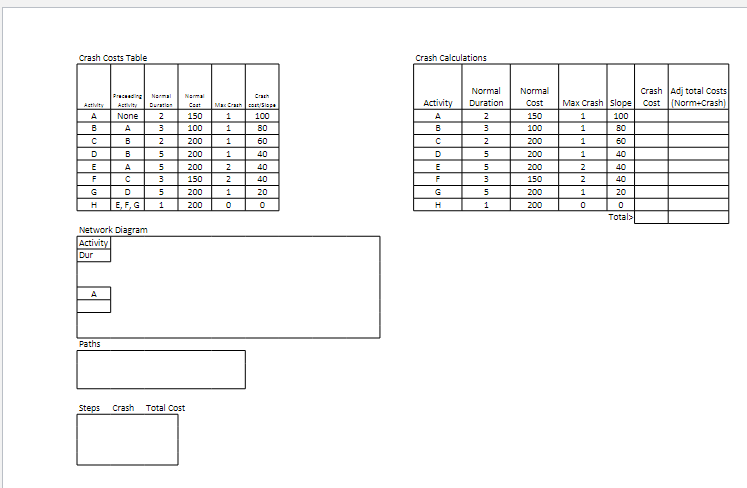
Use this Excel Start File Download Excel Start Fileto
- Create a network diagram
- Calculate paths and identify the critical path
- Create a table that calculates crash costs and adjusted total costs with headings: Activity. Norm Duration, Norm Cost, Max Crash, Slope, Crash Cost, Adj Total Costs, in that order.
- Identify the activity at each step that was crashed, number of crash steps, and total costs
Step by Step Solution
There are 3 Steps involved in it
1 Expert Approved Answer
Step: 1 Unlock

Question Has Been Solved by an Expert!
Get step-by-step solutions from verified subject matter experts
Step: 2 Unlock
Step: 3 Unlock