

Question: Use the information graphic to answer the questions:( A) Identify the federal legislation whose passage led to the changes illustrated in this graph and describe
Use the information graphic to answer the questions:( A) Identify the federal legislation whose passage led to the changes illustrated in this graph and describe what it did.(B) Describe the pattern in black voter registration between 1965 and 1967, as illustrated in the information graphicand draw a conclusion about that pattern.(C) By drawing on one other piece of federal legislation or a constitutional amendment, explain how opportunities for political participation have changed over time in the United States.
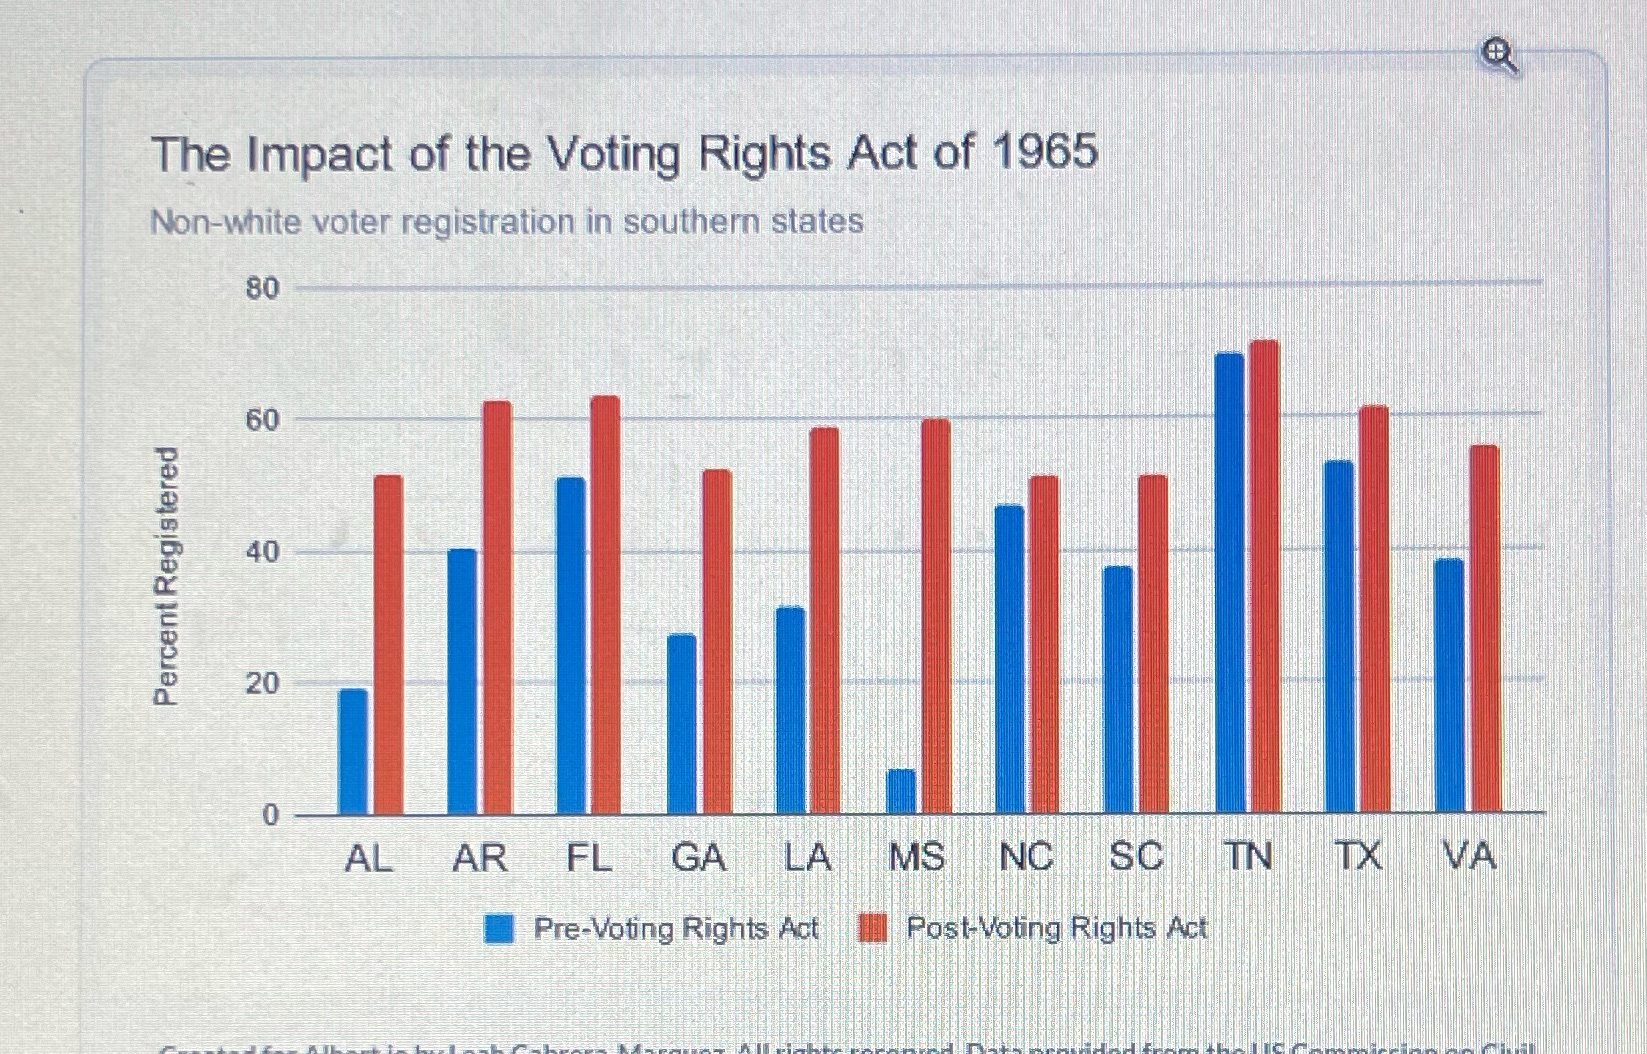
The Impact of the Voting Rights Act of 1965 Non-white voter registration in southern states 80 60 40 Percent Registered 20 0 Pre-Voting Rights Act | Post-Voting Rights Act
Step by Step Solution
There are 3 Steps involved in it

Get step-by-step solutions from verified subject matter experts