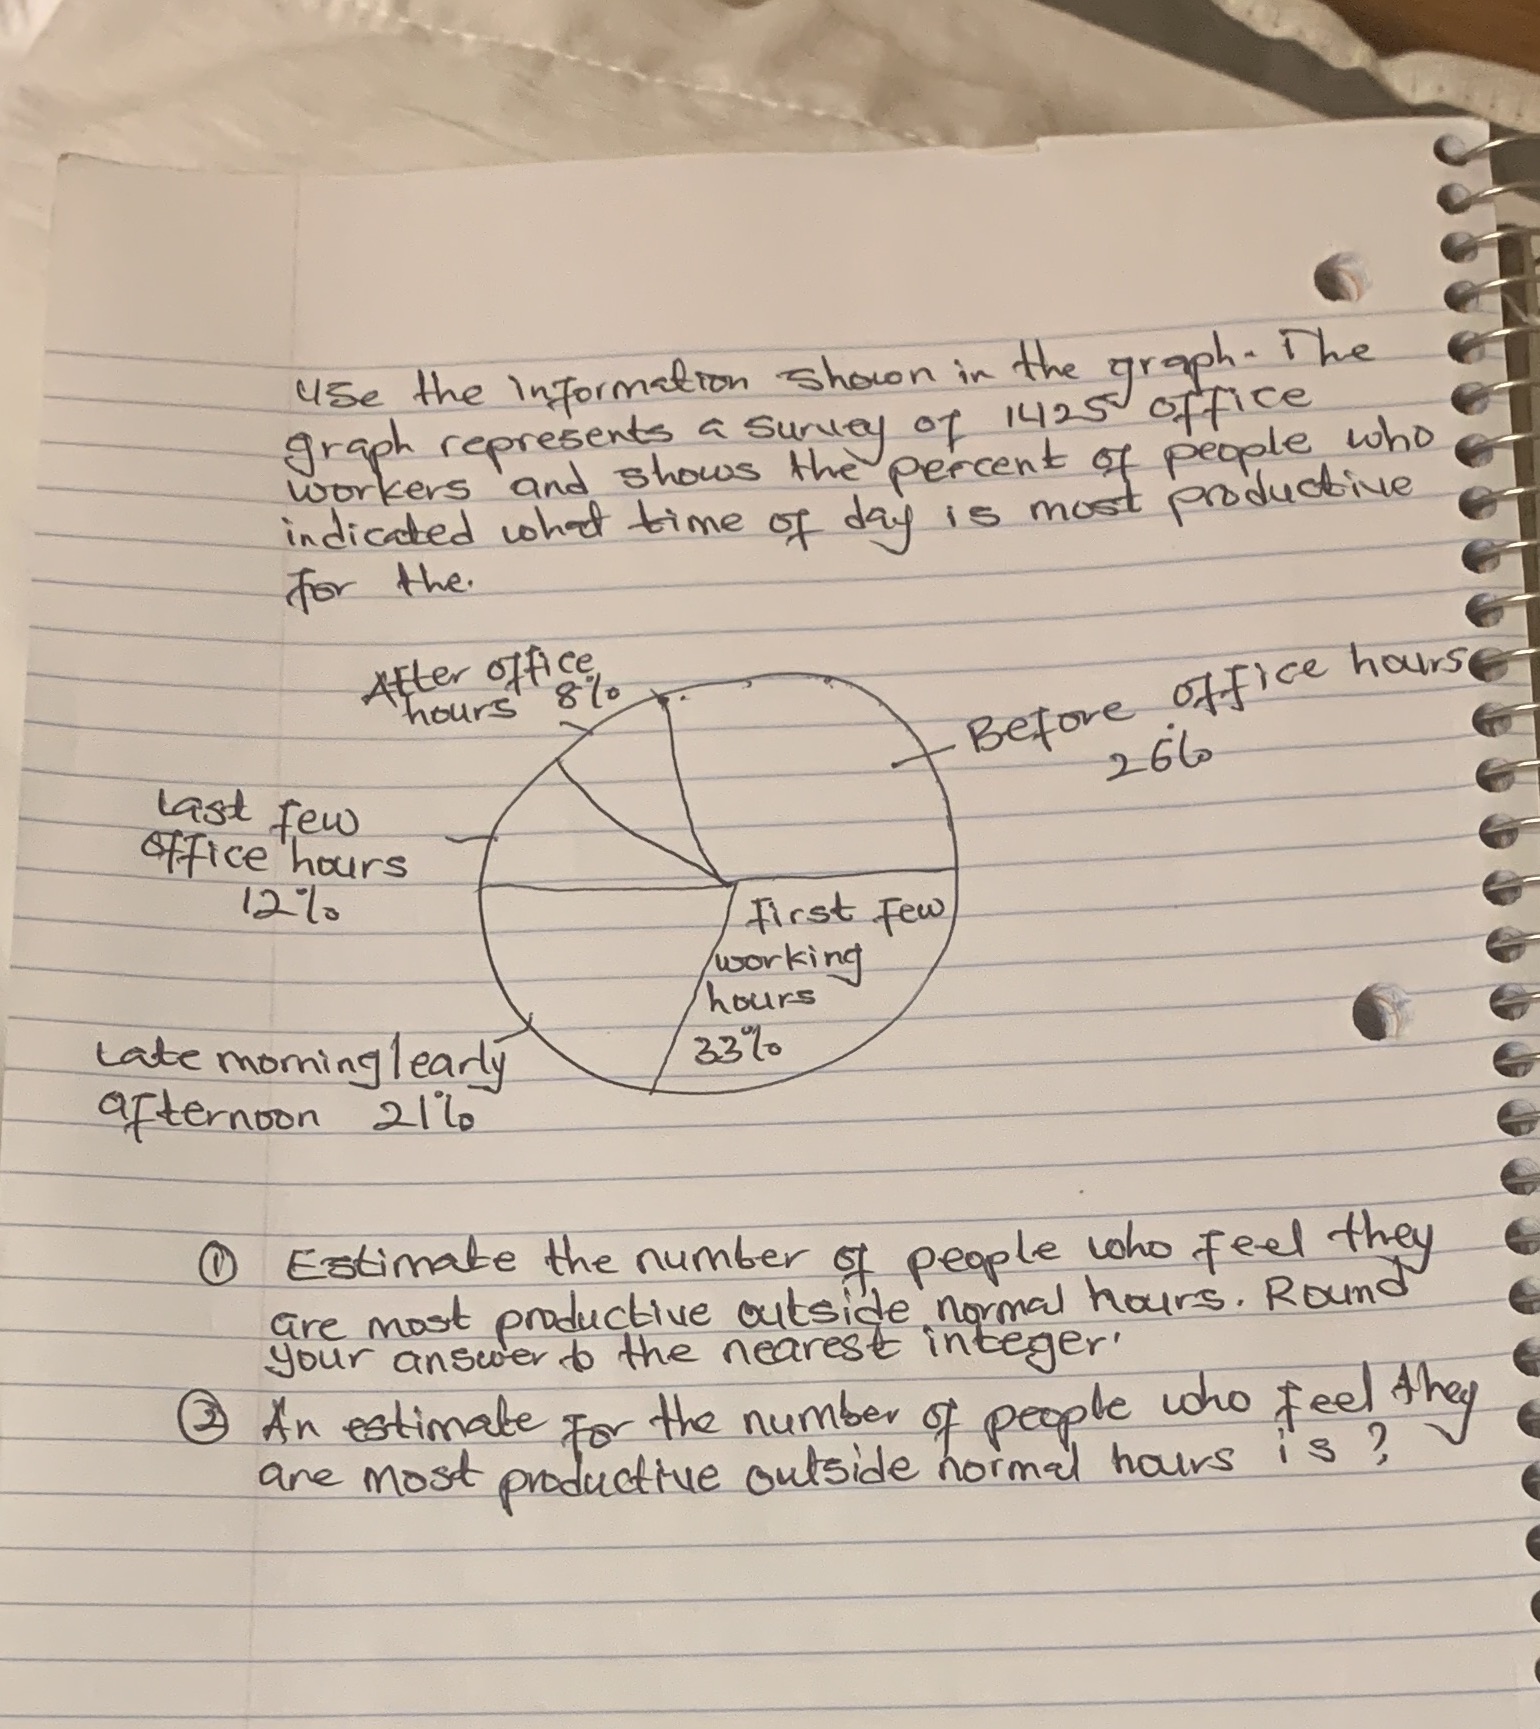
Question: Use the information shown in the graph. The graph represents a survey of 1425 office workers 'and shows the percent of people who indicated what

Use the information shown in the graph. The graph
Use the information shown in the graph. The graph represents a survey of 1425 office workers 'and shows the percent of people who indicated what time of day is most productive for the. After office, hours 8%0 Before office hourse last few 266 office hours 12 10 First Few working hours Late morning learly 3:3%0 afternoon 21 60 1 Estimate the number of people who feel they are most productive outside normal hours . Round your answer to the nearest integer. 3 An estimate For the number of people who feel they are most productive outside normal hours is

Step by Step Solution

There are 3 Steps involved in it

1 Expert Approved Answer
Step: 1 Unlock blur-text-image
Question Has Been Solved by an Expert!

Get step-by-step solutions from verified subject matter experts

Step: 2 Unlock
Step: 3 Unlock

Students Have Also Explored These Related Mathematics Questions!