

Question: Use the information shown in the graph. The graph represents a survey of 1375 office workers and shows the percent of people who indicated
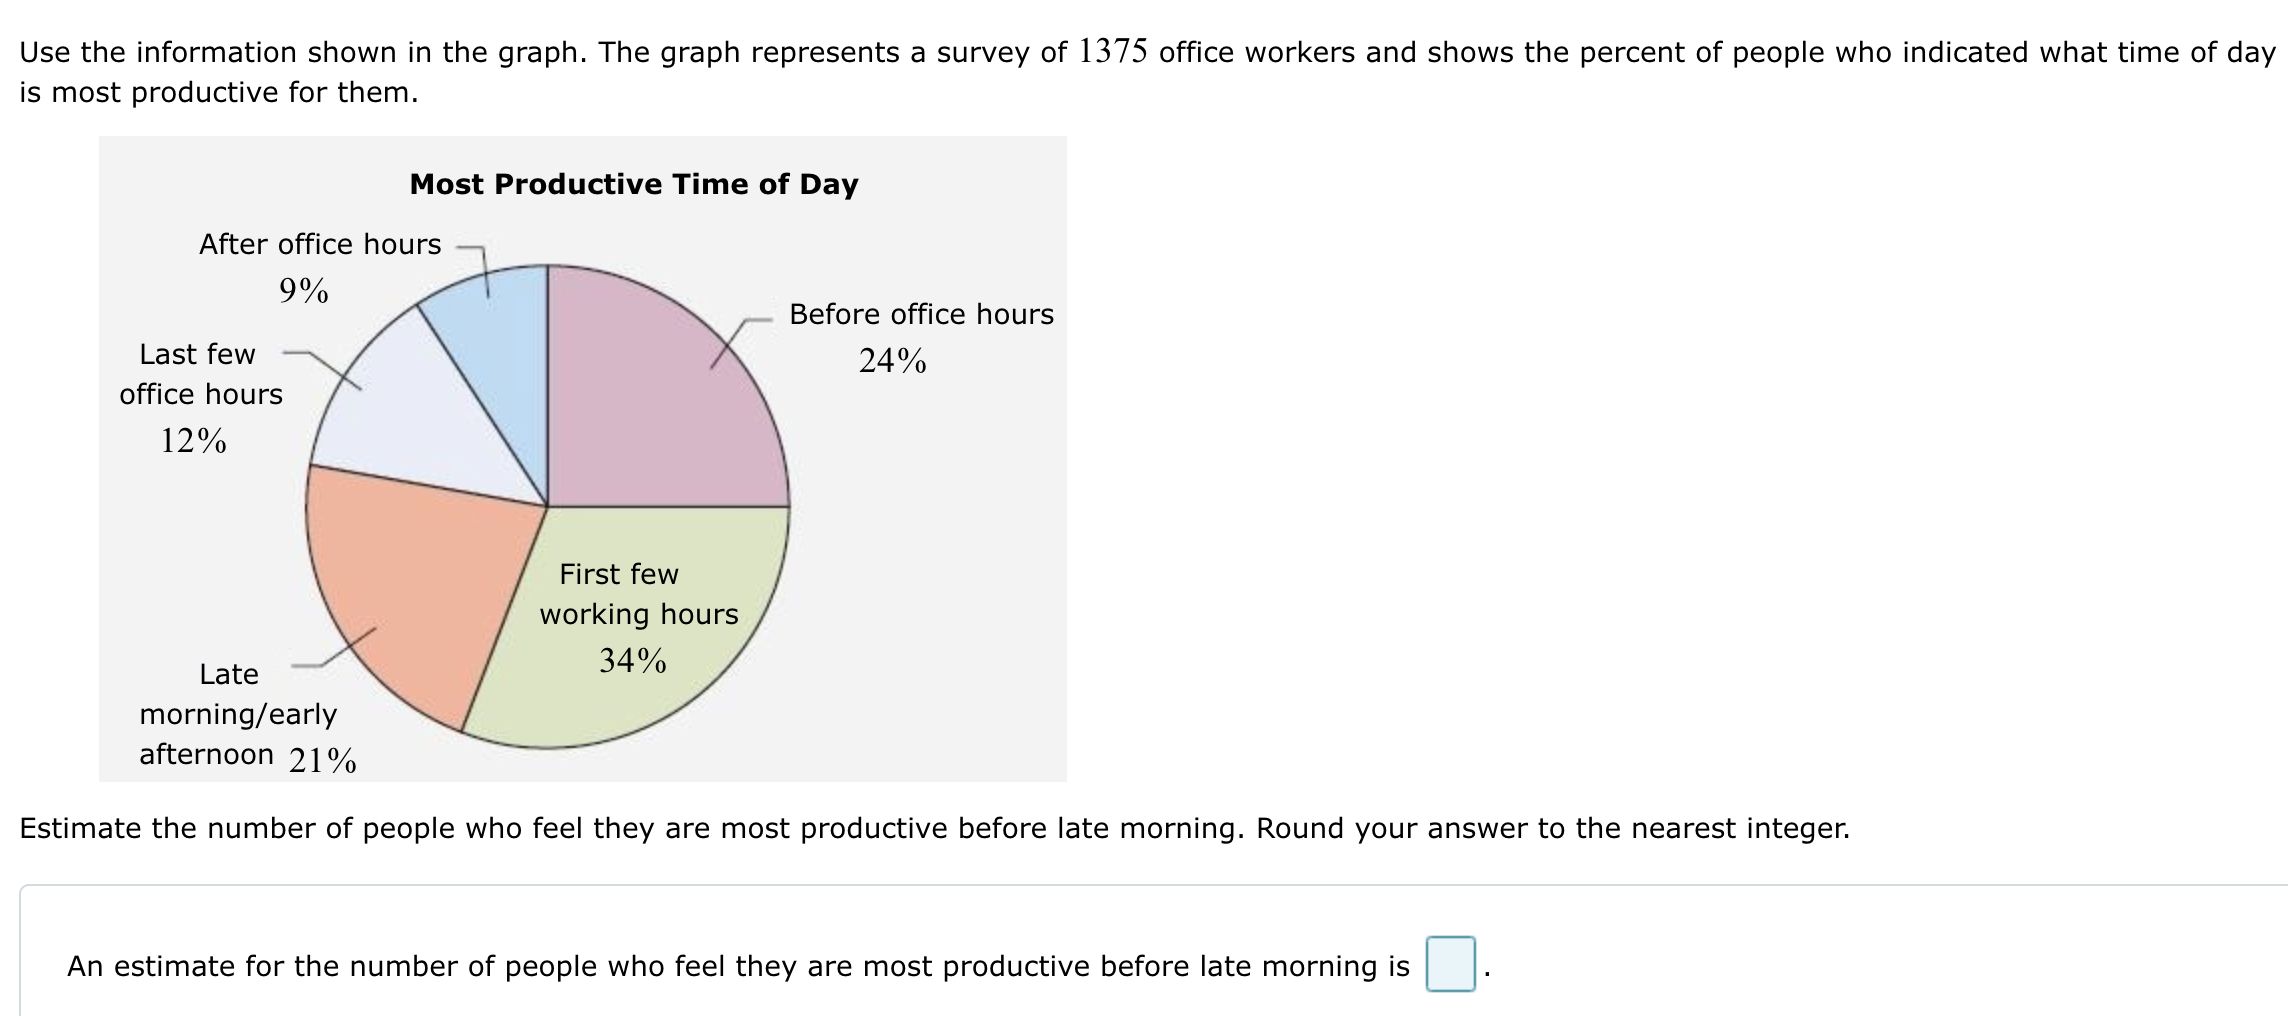
Use the information shown in the graph. The graph represents a survey of 1375 office workers and shows the percent of people who indicated what time of day is most productive for them. Most Productive Time of Day After office hours Last few office hours 12% 9% First few working hours 34% Before office hours 24% Late morning/early afternoon 21% Estimate the number of people who feel they are most productive before late morning. Round your answer to the nearest integer. An estimate for the number of people who feel they are most productive before late morning is
Step by Step Solution
There are 3 Steps involved in it

Get step-by-step solutions from verified subject matter experts