

Question: Use the Linear trendline in this problem. Beta is the measure of an asset's risk in relation to the market (for example, the S&P500)
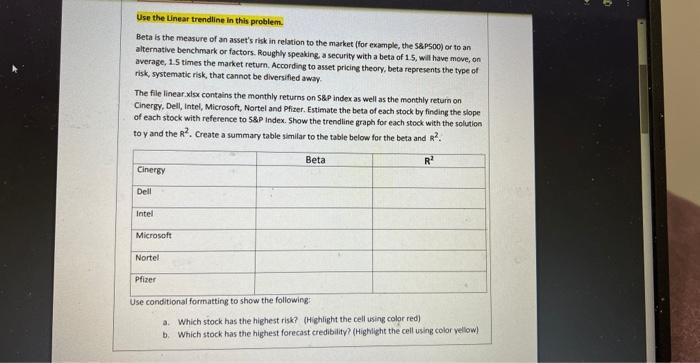
Use the Linear trendline in this problem. Beta is the measure of an asset's risk in relation to the market (for example, the S&P500) or to an alternative benchmark or factors. Roughly speaking, a security with a beta of 1.5, will have move, on average, 1.5 times the market return. According to asset pricing theory, beta represents the type of risk, systematic risk, that cannot be diversified away. The file linear.xlsx contains the monthly returns on S&P index as well as the monthly return on Cinergy, Dell, Intel, Microsoft, Nortel and Pfizer. Estimate the beta of each stock by finding the slope of each stock with reference to S&P Index. Show the trendline graph for each stock with the solution to y and the R2. Create a summary table similar to the table below for the beta and R. Cinergy Dell Intell Beta R Microsoft Nortel Pfizer Use conditional formatting to show the following: a. Which stock has the highest risk? (Highlight the cell using color red) b. Which stock has the highest forecast credibility? (Highlight the cell using color yellow) 0
Step by Step Solution
There are 3 Steps involved in it

Get step-by-step solutions from verified subject matter experts