

Question: Use the Lipid dataset for this practice. Note you should save your results as an RTF file and copy and paste in a word document
Use the Lipid dataset for this practice. Note you should save your results as an RTF file and copy and paste in a word document to create a report for submission The research question is What factors are associated with high cholesterol in male and female?
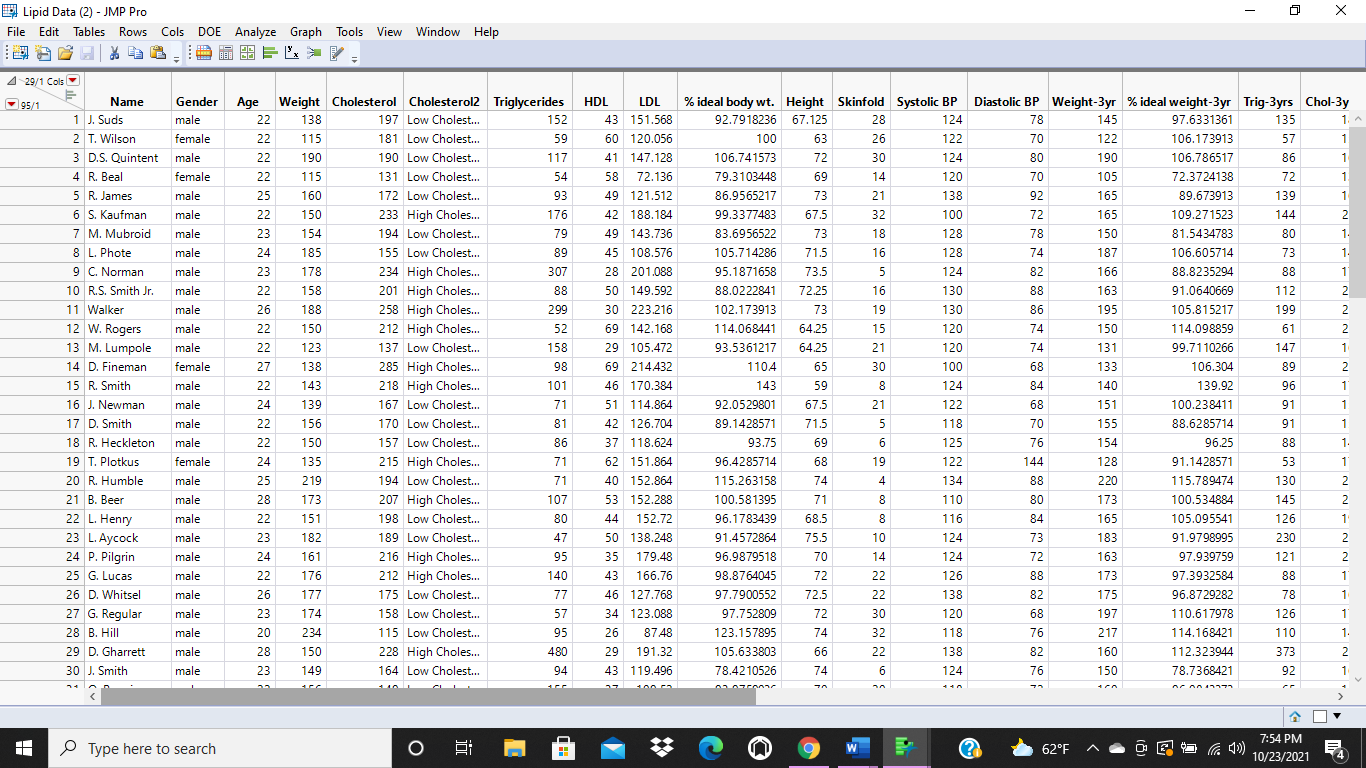
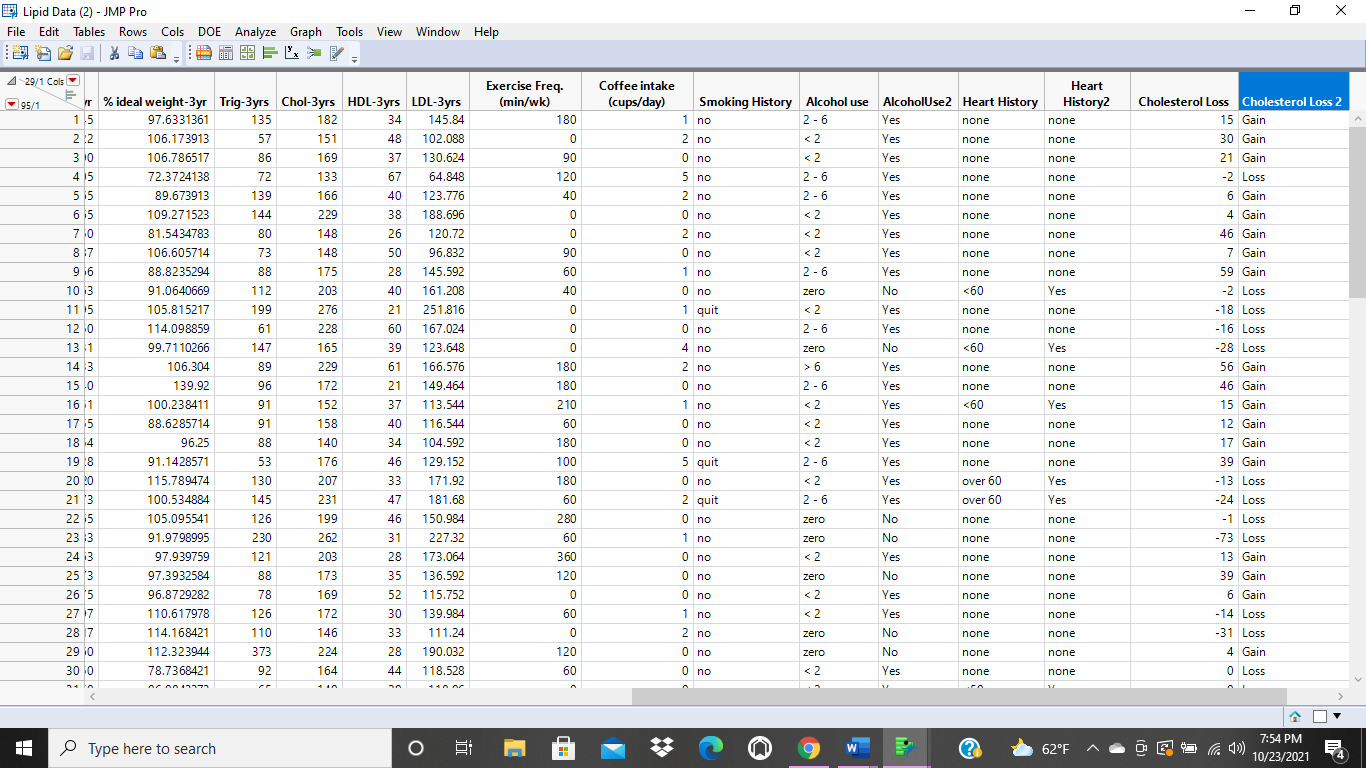
Describe this dataset.
How many numeric- continuous variables are in the dataset? How many nominal variables? How many rows? Use the distribution function (Analyze-Distribution) to obtain the distribution for Age, Weight, HDL, Smoking History and Gender Obtain and report the histogram, the summary statistics (mean & standard deviation frequency) Using the tabulate function, Obtain the mean and standard deviation for Weight, Height, LDL Systolic BP and Diastolic BP). Also add the col% for Heart History & Alcohol use to the table Bivariate Analysis: the 2 x 2 table for two nominal variables
- g X Lipid Data (2) - JMP Pro File Edit Tables Rows Cols DOE Analyze Graph Tools View Window Help O % ca 2x 95/1 WNUNUNNN 4 29/1 Cols E Name Gender Age 1 J. Suds male 22 2 T. Wilson female 22 3 D.S. Quintent male 22 4 R. Beal female 22 5 R. James male 25 6 S. Kaufman male 22 7 M. Mubroid male 23 8 L. Phote male 24 9 C. Norman male 10 R.S. Smith Jr. male 22 11 Walker male 26 12 W. Rogers male 22 13 M. Lumpole male 22 14 D. Fineman female 27 15 R. Smith male 22 16 J. Newman male 24 17 D. Smith male 22 18 R. Heckleton male 22 19 T. Plotkus female 24 20 R. Humble male 25 21 B. Beer male 28 22 L. Henry male 22 23 L. Aycock male 23 24 P. Pilgrin male 24 25 G Lucas male 22 26 D. Whitsel male 26 27 G. Regular male 23 28 B. Hill male 20 29 D. Gharrett male 28 30 J. Smith male 23 Weight Cholesterol Cholesterol2 Triglycerides 138 197 Low Cholest... 152 115 181 Low Cholest... 59 190 190 Low Cholest... 117 115 131 Low Cholest... 54 160 172 Low Cholest... 93 150 233 High Choles... 176 154 194 Low Cholest... 79 185 155 Low Cholest... 89 178 234 High Choles... 307 158 201 High Choles... 88 188 258 High Choles... 299 150 212 High Choles... 52 123 137 Low Cholest... 158 138 285 High Choles... 98 143 218 High Choles... 101 139 167 Low Cholest... 71 156 170 Low Cholest... 81 150 157 Low Cholest... 86 135 215 High Choles.. 71 219 194 Low Cholest... 71 173 207 High Choles... 107 151 198 Low Cholest... 80 182 189 Low Cholest... 47 161 216 High Choles... 95 176 212 High Choles... 140 177 175 Low Cholest... 77 174 158 Low Cholest... 57 234 115 Low Cholest... 95 150 228 High Choles... 480 149 164 Low Cholest... 94 HDL LDL 43 151.568 60 120.056 41 147.128 58 72.136 49 121.512 42 188. 184 49 143.736 45 108.576 28 201.088 50 149.592 30 223.216 69 142.168 29 105.472 69 214.432 46 170.384 51 114.864 42 126.704 37 118.624 62 151.864 40 152.864 53 152.288 44 152.72 50 138.248 35 179.48 43 166.76 46 127.768 34 123.088 26 87.48 29 191.32 43 119.496 % ideal body wt. Height Skinfold Systolic BP 92.7918236 67.125 28 124 100 63 26 122 106.741573 72 30 124 79.3103448 69 14 120 86.9565217 73 21 138 99.3377483 67.5 32 100 83.6956522 73 18 128 105.714286 71.5 16 128 95.1871658 73.5 5 124 88.0222841 72.25 16 130 102.173913 73 19 130 114.068441 64.25 15 120 93.5361217 64.25 21 120 1104 65 30 100 143 59 8 124 92.0529801 67.5 21 122 89.1428571 71.5 5 118 93.75 69 6 125 96.4285714 68 19 122 115.263158 74 4 134 100.581395 71 8 110 96.1783439 68.5 8 116 91.4572864 75.5 10 124 96.9879518 70 14 124 98.8764045 72 22 126 97.7900552 72.5 22 138 97.752809 72 30 120 123.157895 74 32 118 105.633803 66 22 138 78.4210526 74 6 124 Diastolic BP Weight-3yr % ideal weight-3yr Trig-3yrs Chol-3y 78 145 97.6331361 135 1 70 122 106.173913 57 1 80 190 106.786517 86 1 70 105 72.3724138 72 1 92 165 89.673913 139 1 72 165 109.271523 144 2 78 150 81.5434783 80 1. 74 187 106.605714 73 1. 82 166 88.8235294 88 11 88 163 91.0640669 112 2 86 195 105.815217 199 2 74 150 114.098859 61 2 74 131 99.7110266 147 1 68 133 106.304 89 2 84 140 139.92 96 1 68 151 100.238411 91 1 70 155 88.6285714 91 1 76 154 96.25 88 1. 144 128 91.1428571 53 1 88 220 115.789474 130 2 80 173 100.534884 145 2 84 165 105.095541 126 1 73 183 91.9798995 230 2 72 163 97.939759 121 2 88 173 97.3932584 88 11 82 175 96.8729282 78 1 68 197 110.617978 126 1 76 217 114.168421 110 1. 82 160 112.323944 373 2 76 150 78.7368421 92 1 - ACAAN MA - | 0 o Type here to search e o W 62F 7:54 PM 10/23/2021 F - X Lipid Data (2) - JMP Pro File Edit Tables Rows Cols DOE Analyze Graph Tools View Window Help Ex 4 29/1 Cols E Coffee intake (cups/day) 95/1 1 Exercise Freq. (min/wk) 180 0 90 120 40 Heart History2 none AlcoholUse 2 Heart History Yes none Yes none Smoking History Alcohol use 1 no 2 - 6 2 no 6 2-6 6 2-6Step by Step Solution
There are 3 Steps involved in it

Get step-by-step solutions from verified subject matter experts