

Question: Use the Moneyball data set which contains selected statistics for Major League Baseball teams from 1962-2012. You can see a full description of this
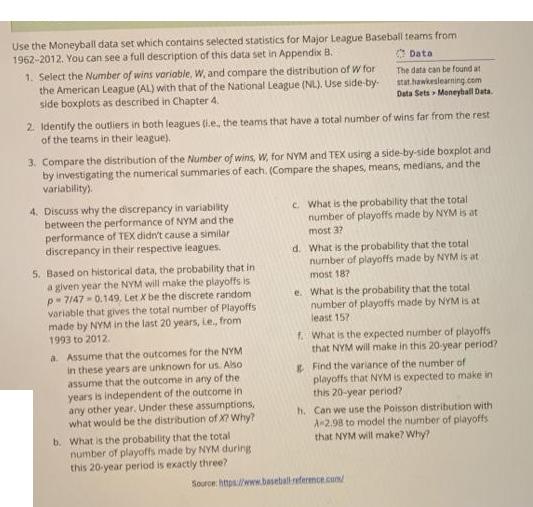
Use the Moneyball data set which contains selected statistics for Major League Baseball teams from 1962-2012. You can see a full description of this data set in Appendix B. Data The data can be found at stat.hawkeslearning.com Data Sets Moneyball Data. 1. Select the Number of wins variable, W, and compare the distribution of W for the American League (AL) with that of the National League (NL). Use side-by- side boxplots as described in Chapter 4. 2. Identify the outliers in both leagues (ie, the teams that have a total number of wins far from the rest of the teams in their league), 3. Compare the distribution of the Number of wins, W, for NYM and TEX using a side-by-side boxplot and by investigating the numerical summaries of each. (Compare the shapes, means, medians, and the variability). 4. Discuss why the discrepancy in variability between the performance of NYM and the performance of TEX didn't cause a similar discrepancy in their respective leagues. 5. Based on historical data, the probability that in a given year the NYM will make the playoffs is p-7/47-0.149, Let X be the discrete random variable that gives the total number of Playoffs made by NYM in the last 20 years, Le., from 1993 to 2012. a. Assume that the outcomes for the NYM in these years are unknown for us. Also- assume that the outcome in any of the years is independent of the outcome in any other year. Under these assumptions, what would be the distribution of X? Why? b. What is the probability that the total number of playoffs made by NYM during this 20-year period is exactly three? c. What is the probability that the total number of playoffs made by NYM is at most 3? d. What is the probability that the total number of playoffs made by NYM is at most 187 e. What is the probability that the total number of playoffs made by NYM is at least 157 f. What is the expected number of playoffs that NYM will make in this 20-year period? Find the variance of the number of playoffs that NYM is expected to make in this 20-year period? h. Can we use the Poisson distribution with A-2.98 to model the number of playoffs that NYM will make? Why? Source: https://www.baseball reference.com/
Step by Step Solution
There are 3 Steps involved in it
SOLUTION Here are the steps to solve this problem Select the Number of wins variable W and compare the distribution of W for the American League AL with that of the National League NL Use sideby side ... View full answer

Get step-by-step solutions from verified subject matter experts