

Question: use the observation sheet:buffers to answer the report buffer capacity in conctsct lens solution OBSERVATIONS SHEET Buffers (2 marks) Tahla 2. Dranarabion af A Table
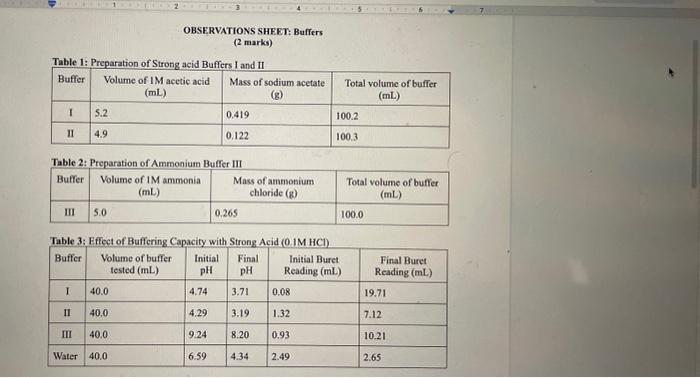
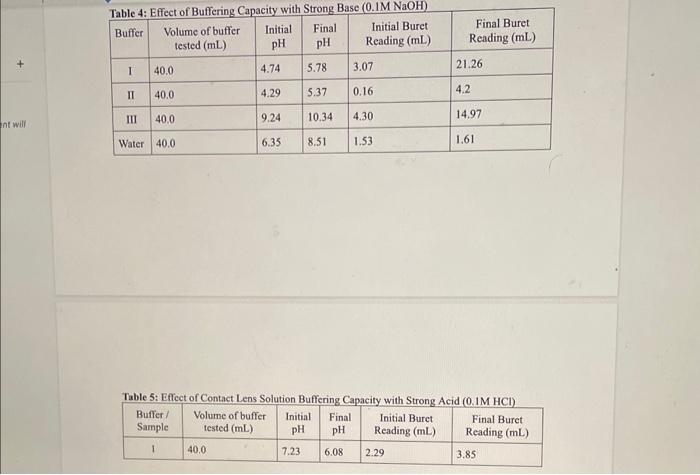
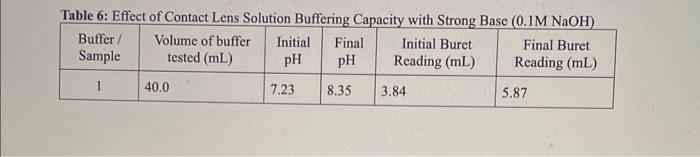
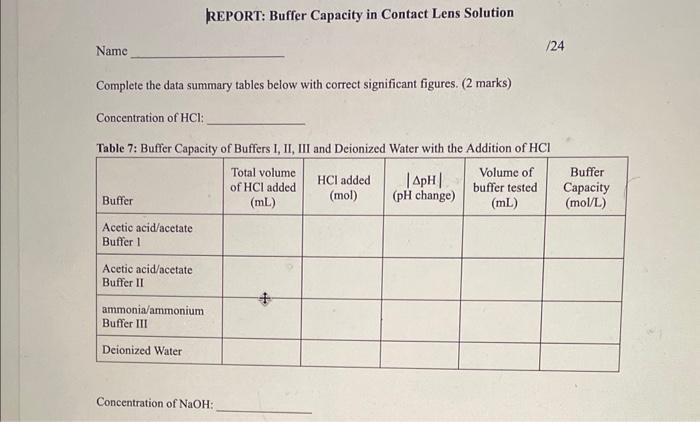
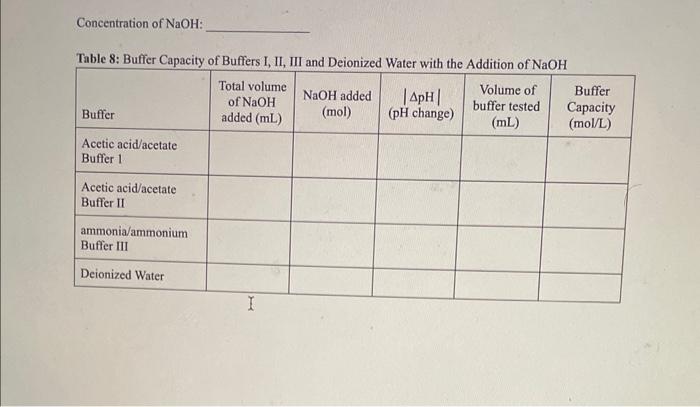
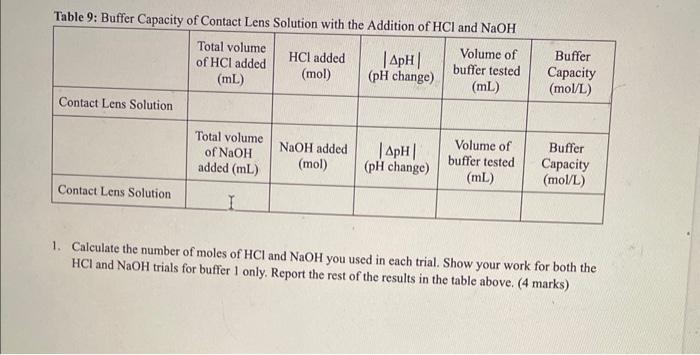
OBSERVATIONS SHEET Buffers (2 marks) Tahla 2. Dranarabion af A Table 3: Effect of Rufferine Canacitv with Strnne Acid in iM WCMh Table 5: Effect of Contact Lens Solution Bufferine Canacitv with Strono Acid in i M Hris Table 6: Effect of Contact Lens Solution Buffering Capacity with Strong Base (0.1MNaOH) \begin{tabular}{|c|l|c|c|c|c|} \hline Buffer/Sample & Volumeofbuffertested(mL) & InitialpH & FinalpH & InitialBuretReading(mL) & FinalBuretReading(mL) \\ \hline 1 & 40.0 & 7.23 & 8.35 & 3.84 & 5.87 \\ \hline \end{tabular} REPORT: Buffer Capacity in Contact Lens Solution Name Complete the data summary tables below with correct significant figures. ( 2 marks) Concentration of HCl : Table 7: Buffer Canacitv of Buffers I. II. III and Deionized Water with the Addition of HC Concentration of NaOH : Table 8: Buffer Capacity of Buffers I, II, III and Deionized Water with the Addition of NaOH Table 9: Buffer Capacity of Contact I ene Solution 1. Calculate the number of moles of HCl and NaOH you used in each trial. Show your work for both the HCl and NaOH trials for buffer 1 only. Report the rest of the results in the table above. (4 marks) 2. Calculate the buffer capacity for each trial. Show your work for both the HCl and NaOH trials for buffer 1 only. Report the rest of the results in the table above. ( 4 marks) 3. Look at your results for deionized water and your buffer solutions. Why does it take such a larger volume of acid to lower the pH ? (Hint: Think about what pH measures.) (2 marks) 4. Compare the buffering capacities of the two acetic acid/acetate ion buffer solutions you made. Do the two buffers have the same buffering capacity? Explain any differences. ( 2 marks) 5. What does the buffer capacity of the contact lens solution tell you about this buffer compared to the other buffers studied in this lab? ( 2 marks) 6. Using your data for buffer II, calculate the theoretical pH that you would expect (the pK2 of acetic acid is 4.76). How does this compare to the initial measured pH of your buffer? ( 3 marks) 7. Using your data for buffer III, calculate the theoretical pH that you would expect (the pKb of ammonia is 4.74). How does this compare to the initial measured pH of your buffer? ( 3 marks) OBSERVATIONS SHEET Buffers (2 marks) Tahla 2. Dranarabion af A Table 3: Effect of Rufferine Canacitv with Strnne Acid in iM WCMh Table 5: Effect of Contact Lens Solution Bufferine Canacitv with Strono Acid in i M Hris Table 6: Effect of Contact Lens Solution Buffering Capacity with Strong Base (0.1MNaOH) \begin{tabular}{|c|l|c|c|c|c|} \hline Buffer/Sample & Volumeofbuffertested(mL) & InitialpH & FinalpH & InitialBuretReading(mL) & FinalBuretReading(mL) \\ \hline 1 & 40.0 & 7.23 & 8.35 & 3.84 & 5.87 \\ \hline \end{tabular} REPORT: Buffer Capacity in Contact Lens Solution Name Complete the data summary tables below with correct significant figures. ( 2 marks) Concentration of HCl : Table 7: Buffer Canacitv of Buffers I. II. III and Deionized Water with the Addition of HC Concentration of NaOH : Table 8: Buffer Capacity of Buffers I, II, III and Deionized Water with the Addition of NaOH Table 9: Buffer Capacity of Contact I ene Solution 1. Calculate the number of moles of HCl and NaOH you used in each trial. Show your work for both the HCl and NaOH trials for buffer 1 only. Report the rest of the results in the table above. (4 marks) 2. Calculate the buffer capacity for each trial. Show your work for both the HCl and NaOH trials for buffer 1 only. Report the rest of the results in the table above. ( 4 marks) 3. Look at your results for deionized water and your buffer solutions. Why does it take such a larger volume of acid to lower the pH ? (Hint: Think about what pH measures.) (2 marks) 4. Compare the buffering capacities of the two acetic acid/acetate ion buffer solutions you made. Do the two buffers have the same buffering capacity? Explain any differences. ( 2 marks) 5. What does the buffer capacity of the contact lens solution tell you about this buffer compared to the other buffers studied in this lab? ( 2 marks) 6. Using your data for buffer II, calculate the theoretical pH that you would expect (the pK2 of acetic acid is 4.76). How does this compare to the initial measured pH of your buffer? ( 3 marks) 7. Using your data for buffer III, calculate the theoretical pH that you would expect (the pKb of ammonia is 4.74). How does this compare to the initial measured pH of your buffer? ( 3 marks)
Step by Step Solution
There are 3 Steps involved in it

Get step-by-step solutions from verified subject matter experts