

Question: Use the probability distribution or histogram to find the (a) mean, (b) variance, (c) standard deviation, and (d) expected value of the probability distribution,
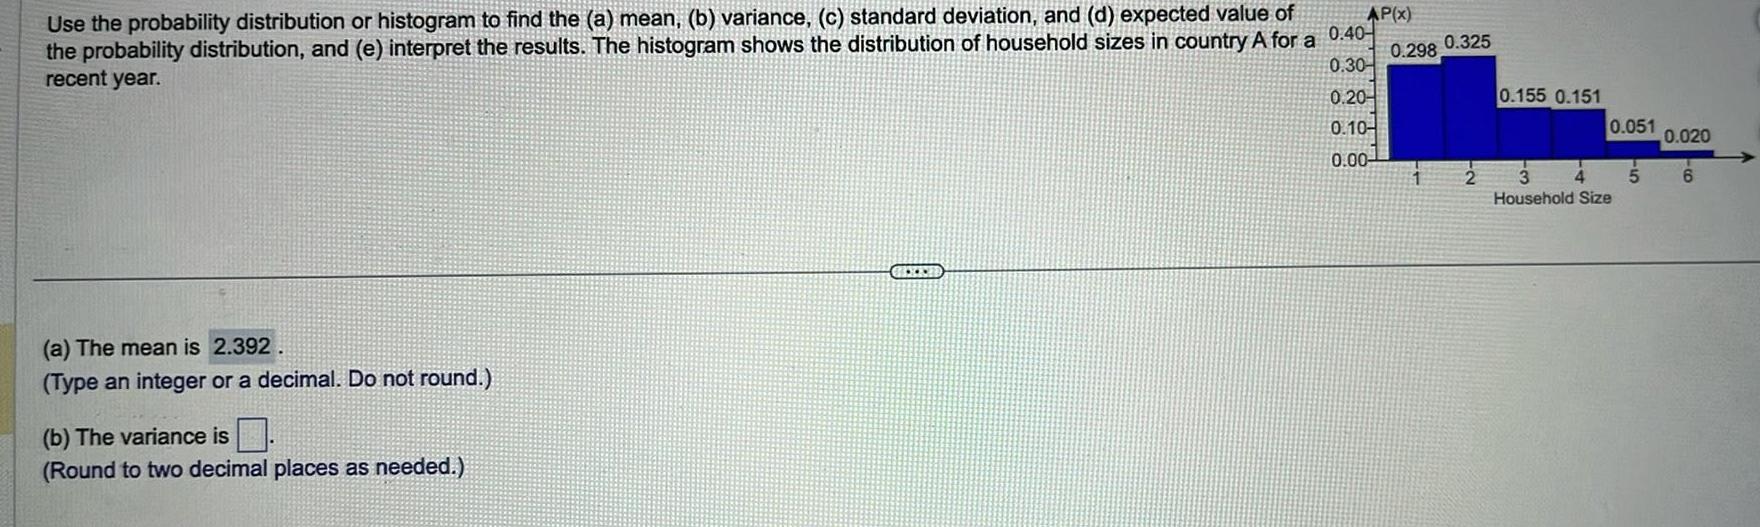
Use the probability distribution or histogram to find the (a) mean, (b) variance, (c) standard deviation, and (d) expected value of the probability distribution, and (e) interpret the results. The histogram shows the distribution of household sizes in country A for a 0.40 recent year. (a) The mean is 2.392. (Type an integer or a decimal. Do not round.) (b) The variance is (Round to two decimal places as needed.) AP(x) 0.325 0.298, 0.30 0.20- 0.155 0.151 0.10- 0.051 0.020 0.00- -2 3 5 6 Household Size
Step by Step Solution
There are 3 Steps involved in it
1 Expert Approved Answer
Step: 1 Unlock

Question Has Been Solved by an Expert!
Get step-by-step solutions from verified subject matter experts
Step: 2 Unlock
Step: 3 Unlock