

Question: Use the probability distribution or histogram to nd the (a) mean, (b) variance, (c) standard deviation, and (d) expected value of the probability distribution, and
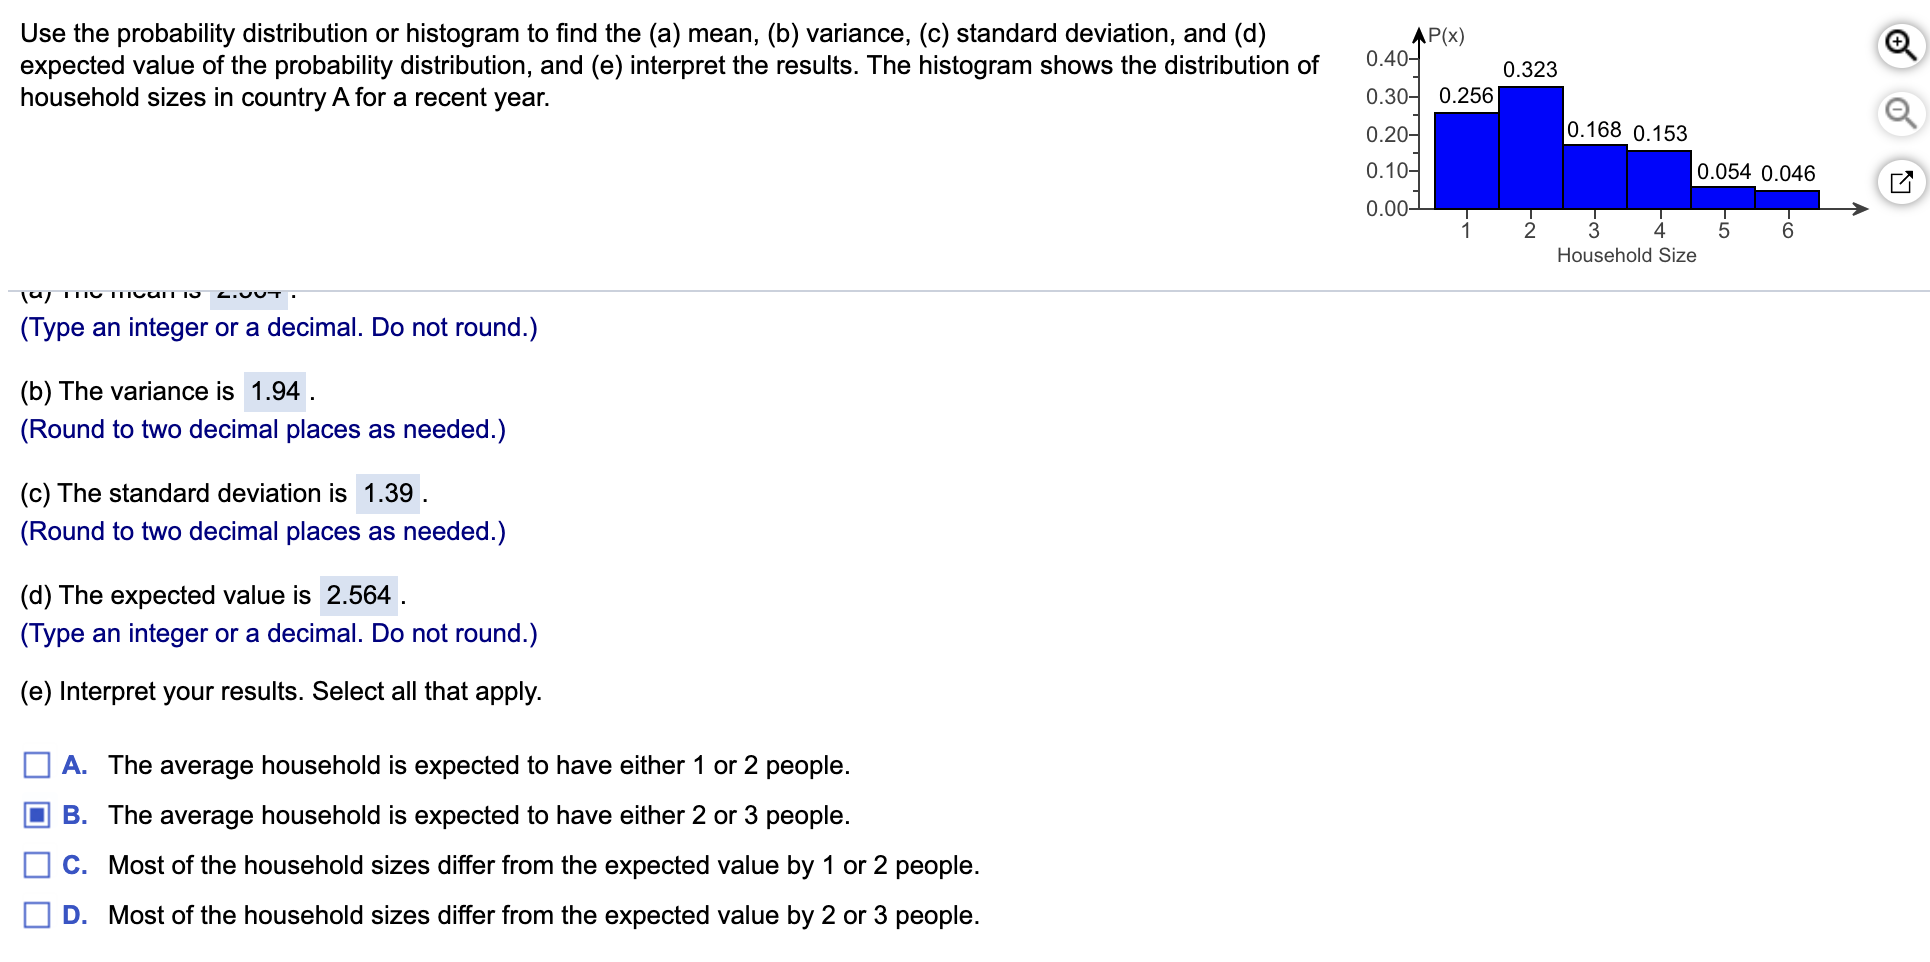
Use the probability distribution or histogram to nd the (a) mean, (b) variance, (c) standard deviation, and (d) expected value of the probability distribution, and (e) interpret the results. The histogram shows the distribution of household sizes in countryAfor a recent year. 5 Household Size \\u, I In, .nuun m .vvr . (Type an integer or a decimal. Do not round.) (b) The variance is 1.94 . (Round to two decimal places as needed.) (0) The standard deviation is 1.39 . (Round to two decimal places as needed.) (d) The expected value is 2.564 . (Type an integer or a decimal. Do not round.) (e) Interpret your results. Select all that apply. E] A. The average household is expected to have either 1 or 2 people. E] B. The average household is expected to have either 2 or 3 people. 1:] C. Most of the household sizes differ from the expected value by 1 or 2 people. E] D. Most of the household sizes differ from the expected value by 2 or 3 people
Step by Step Solution
There are 3 Steps involved in it

Get step-by-step solutions from verified subject matter experts