Question: . Use the project description presented in the table below for the following questions: 1 Use the project description presented in the table below for

. Use the project description presented in the table below for the following questions:. Use the project description presented in the

1 Use the project description presented in the table below for the following questions: Ammediate Optimistic Time Most likely Time Pessimistic Time Predecessor 352 9 15 HI (a) Calculate the expected time for each activity (b) Calculate the variance for each activity (c) Using the information given, construct a network diagram Use both the longest path method and ES EF, LSLF method for the following questions and show your answers in the table below. (d) What is the expected project completion time? (e) What are the critical activities? (1) What are the stack values for noe-critical activities? The Longest Path Method IES EFLS LF Expected project finish time Critical activities Non-critical activities (slack values) (g) Calculate the probability that the project will be completed in 40 weeks. (h) Calculate the probability that the project will be completed in 43 weeks

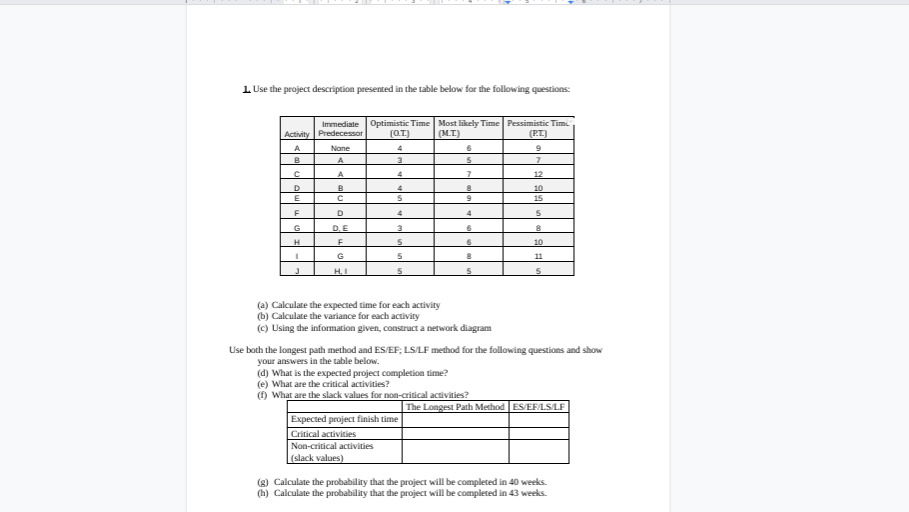
Step by Step Solution

There are 3 Steps involved in it

1 Expert Approved Answer
Step: 1 Unlock blur-text-image
Question Has Been Solved by an Expert!

Get step-by-step solutions from verified subject matter experts

Step: 2 Unlock
Step: 3 Unlock

Students Have Also Explored These Related General Management Questions!