

Question: USE THE PROJECTED INCOME STATEMENT THAT IS AVALABLE ON P. 510 EXHIBIT 9.2. ASSUME THAT THE DATA FOR 2006 FROM P. 510 IS THE HIGH
 USE THE PROJECTED INCOME STATEMENT THAT IS AVALABLE ON P. 510 EXHIBIT 9.2. ASSUME THAT THE DATA FOR 2006 FROM P. 510 IS THE HIGH SCENARIO THAT HAS A 50% PROBABLILIY OF BEING MATERIALIZED. CREATE 2 ADDITIONAL SCENARIOS FOR THE ABOVE PROJECTIONS, INCLUDING AN AVERAGE SCHENARIO WITH 30% PROBABILITY AND A LOW SCENARION WITH 20% PROBABILITY. UPON COMPLETION OF THE 3 SCENRIOS, CREATE A PROBABILITY WEIGHTED SCENARIO FOR THE ABOVE 3 SCENARIOS.
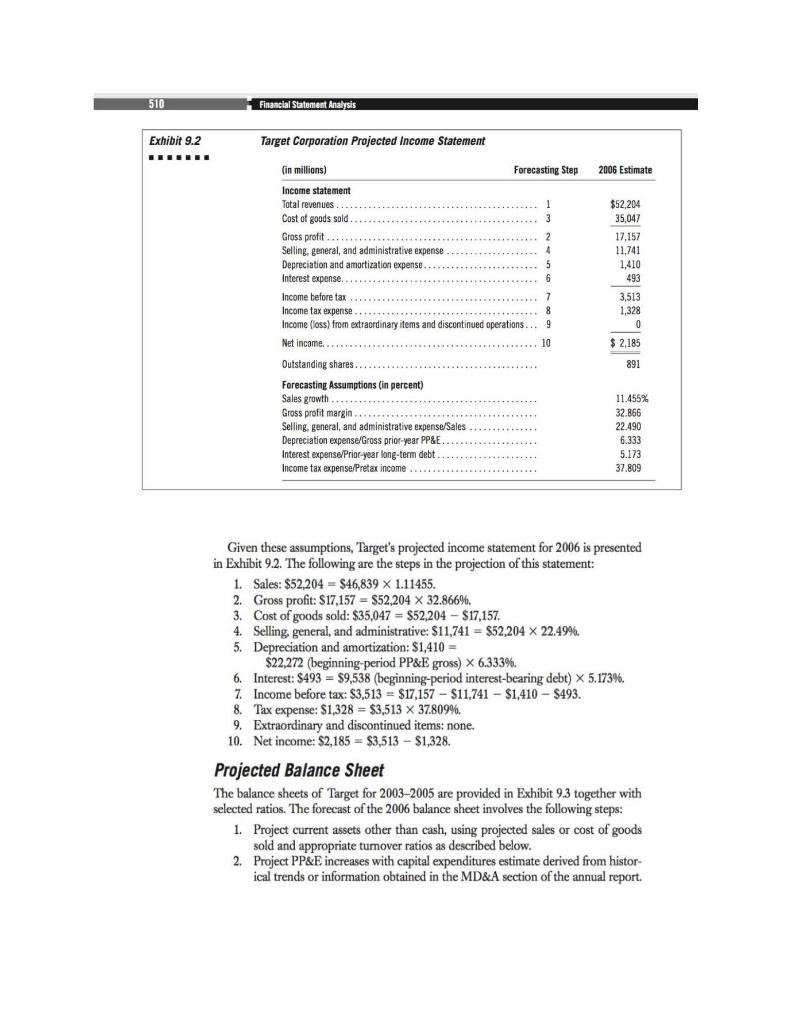
510 Financial Statement Analysis Exhibit 9.2 Target Corporation Projected Income Statement (in millions) Forecasting Step 2006 Estimate 105 Estimate $52,204 35,047 17,157 11,741 1,410 493 Income statement Total revenues..... Cost of goods sold 3 Gross profit 2 Selling, general, and administrative expense 4 Depreciation and amortization expense. 5 Interest expense.... 6 Income before tax... 7 Income tax expense....******** 8 Income (loss) from extraordinary items and discontinued operations... 9 Net income... 10 Outstanding shares... Forecasting Assumptions (in percent) Sales growth. Gross profit margin... Selling, general, and administrative expense/Sales Depreciation expense/Gross prior-year PP&E Interest expense/Prior-year long-term debt Income tax expense/Pretax income 3,513 1,328 0 $ 2,185 891 11.455% 32.866 22.490 6.333 5.173 37.809 Given these assumptions, Target's projected income statement for 2006 is presented in Exhibit 9.2. The following are the steps in the projection of this statement: 1. Sales: $52,204 = $46,839 X 1.11455. 2. Gross profit: $17,157 $52,204 x 32.866%. 3. Cost of goods sold: $35,047 = $52,204 - $17,157. 4. Selling general, and administrative: $11,741 = $52,204 X 22.49%. 5. Depreciation and amortization: $1,410 = $22,272 (beginning-period PP&E gross) X 6.333%. 6. Interest: $493 = 59,538 (beginning-period interest-bearing debt) x 5.173%. 7. Income before tax: $3,513 = $17,157 - $11.741 - $1,410 - $493. 8. Tax expense: $1,328 = $3,513 x 37.809%. 9. Extraordinary and discontinued items: none 10. Net income: 2,185 = $3,513 - $1,328. Projected Balance Sheet The balance sheets of Target for 2003-2005 are provided in Exhibit 9.3 together with selected ratios. The forecast of the 2006 balance sheet involves the following steps: 1. Project current assets other than cash, using projected sales or cost of goods sold and appropriate tumover ratios as described below. 2. Project PP&E increases with capital expenditures estimate derived from histor- ical trends or information obtained in the MD&A section of the annual report. 510 Financial Statement Analysis Exhibit 9.2 Target Corporation Projected Income Statement (in millions) Forecasting Step 2006 Estimate 105 Estimate $52,204 35,047 17,157 11,741 1,410 493 Income statement Total revenues..... Cost of goods sold 3 Gross profit 2 Selling, general, and administrative expense 4 Depreciation and amortization expense. 5 Interest expense.... 6 Income before tax... 7 Income tax expense....******** 8 Income (loss) from extraordinary items and discontinued operations... 9 Net income... 10 Outstanding shares... Forecasting Assumptions (in percent) Sales growth. Gross profit margin... Selling, general, and administrative expense/Sales Depreciation expense/Gross prior-year PP&E Interest expense/Prior-year long-term debt Income tax expense/Pretax income 3,513 1,328 0 $ 2,185 891 11.455% 32.866 22.490 6.333 5.173 37.809 Given these assumptions, Target's projected income statement for 2006 is presented in Exhibit 9.2. The following are the steps in the projection of this statement: 1. Sales: $52,204 = $46,839 X 1.11455. 2. Gross profit: $17,157 $52,204 x 32.866%. 3. Cost of goods sold: $35,047 = $52,204 - $17,157. 4. Selling general, and administrative: $11,741 = $52,204 X 22.49%. 5. Depreciation and amortization: $1,410 = $22,272 (beginning-period PP&E gross) X 6.333%. 6. Interest: $493 = 59,538 (beginning-period interest-bearing debt) x 5.173%. 7. Income before tax: $3,513 = $17,157 - $11.741 - $1,410 - $493. 8. Tax expense: $1,328 = $3,513 x 37.809%. 9. Extraordinary and discontinued items: none 10. Net income: 2,185 = $3,513 - $1,328. Projected Balance Sheet The balance sheets of Target for 2003-2005 are provided in Exhibit 9.3 together with selected ratios. The forecast of the 2006 balance sheet involves the following steps: 1. Project current assets other than cash, using projected sales or cost of goods sold and appropriate tumover ratios as described below. 2. Project PP&E increases with capital expenditures estimate derived from histor- ical trends or information obtained in the MD&A section of the annual report
Step by Step Solution
There are 3 Steps involved in it

Get step-by-step solutions from verified subject matter experts