

Question: Use the random numbers provided and the table in the previous step to find the daily ending stock prices for the simulation data. - ecimals
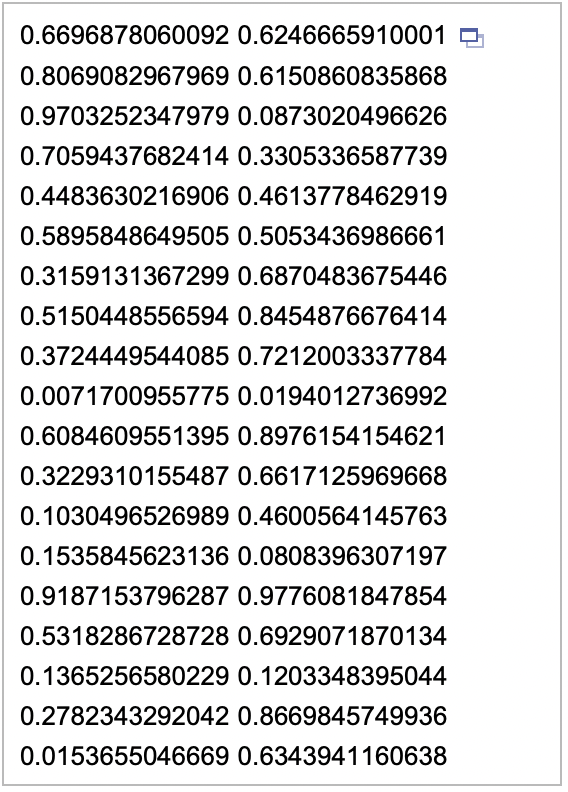
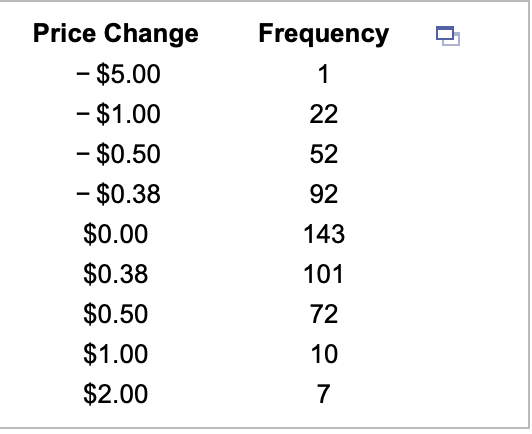
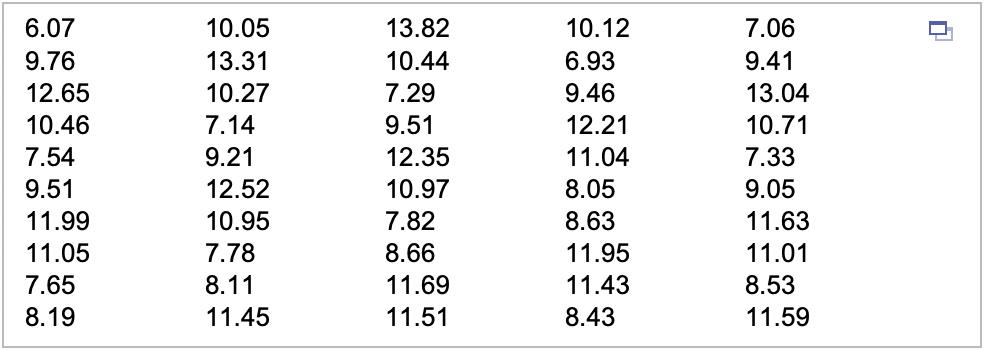
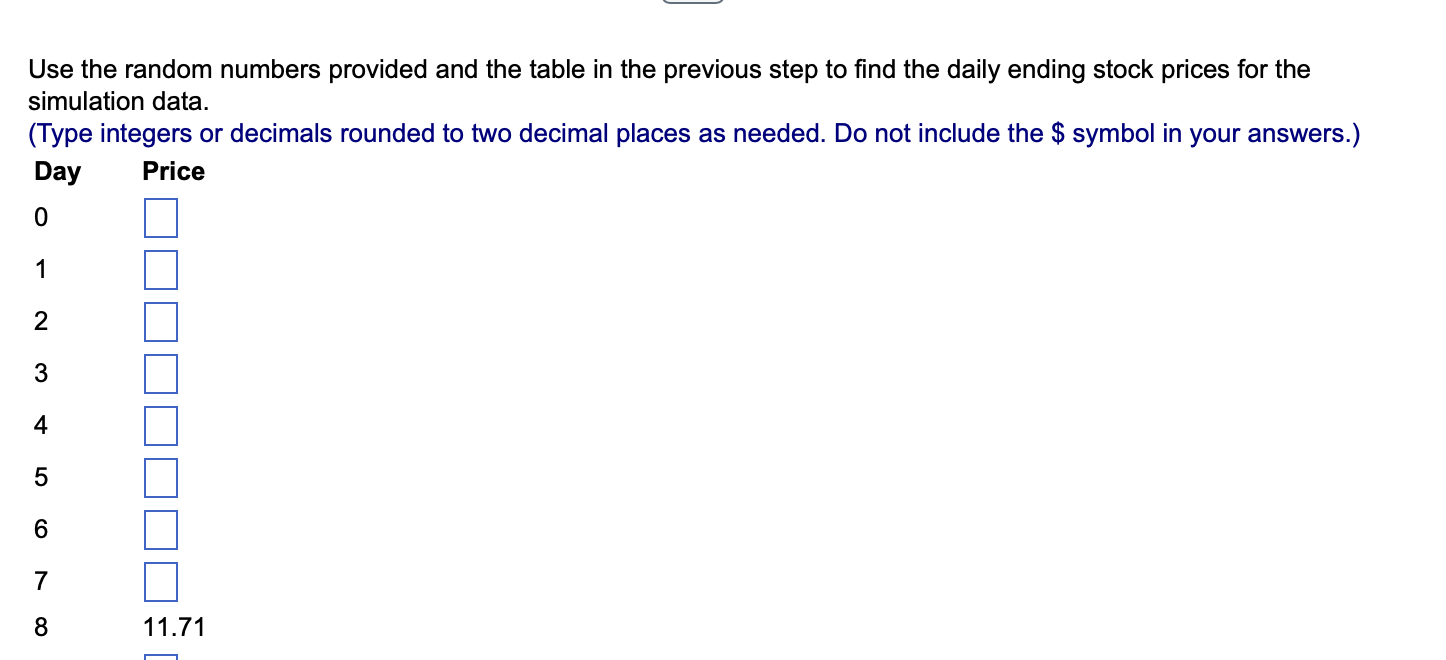
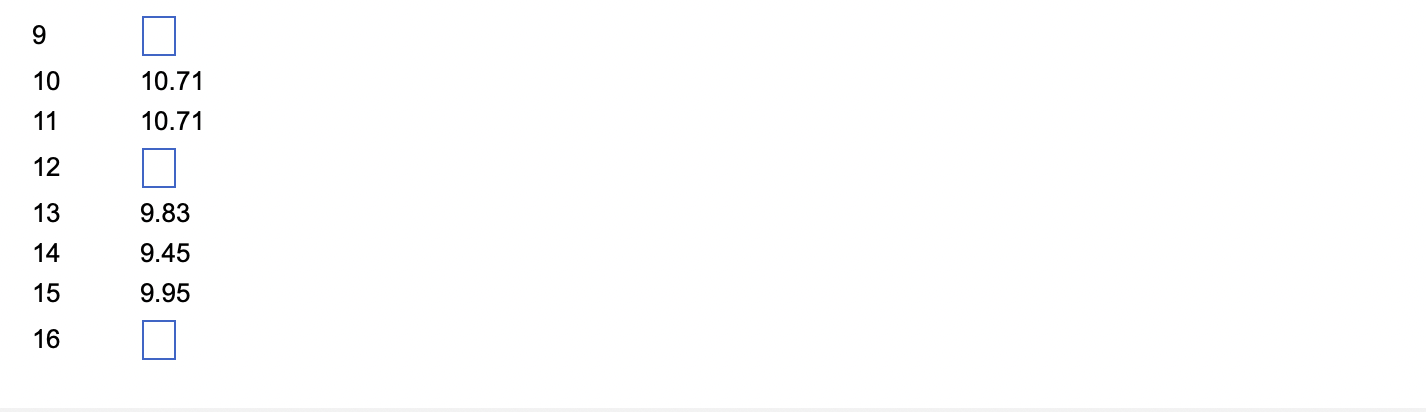
Use the random numbers provided and the table in the previous step to find the daily ending stock prices for the simulation data. - ecimals rounded to two decimal places as needed. Do not include the $ symbol in your answers.) A certain company produces software designed to enhance company creativity. The current stock price for the company is $9.95 per share. The daily changes in stock price over the last 500 trading days have been analyzed, resulting in the accompanying frequency distribution. Develop a spreadsheet model to simulate the stock performance over the next 50 trading days. Use Monte Carlo simulation with 50 trials to replicate the spreadsheet and find the distribution of the ending stock price. Click here to view the frequency distribution. Click here to view the random numbers. Click here to view the simulation data for the stock prices. 0.66968780600920 .6246665910001 0.80690829679690 .6150860835868 0.97032523479790 .0873020496626 0.70594376824140 .3305336587739 0.44836302169060 .4613778462919 0.58958486495050 .5053436986661 0.31591313672990 .6870483675446 0.51504485565940 .8454876676414 0.37244495440850 .7212003337784 0.00717009557750 .0194012736992 0.60846095513950 .8976154154621 0.32293101554870 .6617125969668 0.10304965269890 .4600564145763 0.15358456231360 .0808396307197 0.91871537962870 .9776081847854 0.53182867287280 .6929071870134 0.13652565802290 .1203348395044 0.27823432920420 .8669845749936 0.01536550466690 .6343941160638 91011121314151610.7110.719.839.459.95 \begin{tabular}{|llllll|} \hline 6.07 & 10.05 & 13.82 & 10.12 & 7.06 & \\ 9.76 & 13.31 & 10.44 & 6.93 & 9.41 & \\ 12.65 & 10.27 & 7.29 & 9.46 & 13.04 & \\ 10.46 & 7.14 & 9.51 & 12.21 & 10.71 & \\ 7.54 & 9.21 & 12.35 & 11.04 & 7.33 & \\ 9.51 & 12.52 & 10.97 & 8.05 & 9.05 & \\ 11.99 & 10.95 & 7.82 & 8.63 & 11.63 & \\ 11.05 & 7.78 & 8.66 & 11.95 & 11.01 & \\ 7.65 & 8.11 & 11.69 & 11.43 & 8.53 & \\ 8.19 & 11.45 & 11.51 & 8.43 & 11.59 & \\ \hline \end{tabular} Price Change $5.00 $1.00 $0.50 - $0.38 $0.00 $0.38 $0.50 $1.00 $2.00 Frequency 1 22 52 92 143 101 72 10 7 Use the random numbers provided and the table in the previous step to find the daily ending stock prices for the simulation data. - ecimals rounded to two decimal places as needed. Do not include the $ symbol in your answers.) A certain company produces software designed to enhance company creativity. The current stock price for the company is $9.95 per share. The daily changes in stock price over the last 500 trading days have been analyzed, resulting in the accompanying frequency distribution. Develop a spreadsheet model to simulate the stock performance over the next 50 trading days. Use Monte Carlo simulation with 50 trials to replicate the spreadsheet and find the distribution of the ending stock price. Click here to view the frequency distribution. Click here to view the random numbers. Click here to view the simulation data for the stock prices. 0.66968780600920 .6246665910001 0.80690829679690 .6150860835868 0.97032523479790 .0873020496626 0.70594376824140 .3305336587739 0.44836302169060 .4613778462919 0.58958486495050 .5053436986661 0.31591313672990 .6870483675446 0.51504485565940 .8454876676414 0.37244495440850 .7212003337784 0.00717009557750 .0194012736992 0.60846095513950 .8976154154621 0.32293101554870 .6617125969668 0.10304965269890 .4600564145763 0.15358456231360 .0808396307197 0.91871537962870 .9776081847854 0.53182867287280 .6929071870134 0.13652565802290 .1203348395044 0.27823432920420 .8669845749936 0.01536550466690 .6343941160638 91011121314151610.7110.719.839.459.95 \begin{tabular}{|llllll|} \hline 6.07 & 10.05 & 13.82 & 10.12 & 7.06 & \\ 9.76 & 13.31 & 10.44 & 6.93 & 9.41 & \\ 12.65 & 10.27 & 7.29 & 9.46 & 13.04 & \\ 10.46 & 7.14 & 9.51 & 12.21 & 10.71 & \\ 7.54 & 9.21 & 12.35 & 11.04 & 7.33 & \\ 9.51 & 12.52 & 10.97 & 8.05 & 9.05 & \\ 11.99 & 10.95 & 7.82 & 8.63 & 11.63 & \\ 11.05 & 7.78 & 8.66 & 11.95 & 11.01 & \\ 7.65 & 8.11 & 11.69 & 11.43 & 8.53 & \\ 8.19 & 11.45 & 11.51 & 8.43 & 11.59 & \\ \hline \end{tabular} Price Change $5.00 $1.00 $0.50 - $0.38 $0.00 $0.38 $0.50 $1.00 $2.00 Frequency 1 22 52 92 143 101 72 10 7
Step by Step Solution
There are 3 Steps involved in it

Get step-by-step solutions from verified subject matter experts