

Question: Use the routine sig_noise to generate a waveform containing 200- and 400-Hz sine waves as in Problems 9 and 10 with an SNR of 12dB
 Use the routine sig_noise to generate a waveform containing 200- and 400-Hz sine waves as in Problems 9 and 10 with an SNR of 12dB with 1000 points. Plot only the nonredundant points (no DC term) in the magnitude spectrum. Repeat for the same SNR, but for a signal with only 100 points.
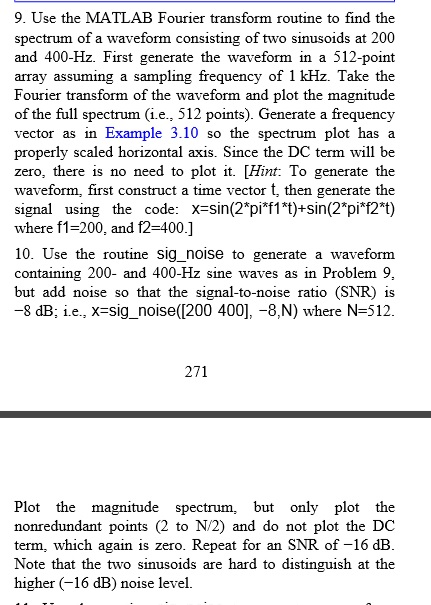
9. Use the MATLAB Fourier transform routine to find the spectrum of a waveform consisting of two sinusoids at the 200 and 400-Hz. First generate the waveform in a 512-point array assuming a sampling frequency of 1 kHz. Take the Fourier transform of the waveform and plot the magnitude of the full spectrum (ie.. 512 points). Generate a frequency vector as in Example 3.10 so the spectrum plot has a properly scaled horizontal axis. Since the DC term will be zero, there is no need to plot it. Hint: To generate the waveform, first construct a time vector t, then generate the signal using the code: x sin(2*pi*f1*t)+sin (2*pi*f2't) 10. se the routine sig noise to generate a waveform containing 200- and 400-Hz sine waves as in Problem 9 but add noise so that the signal-to-noise ratio (SNR) is 8 dB ie.. x sig noise(1200 400], -8,N) where N 512. 271 Plot the magnitude spectrum but only plot the nonredundant points (2 to N/2) and do not plot the DC term, which again is zero. Repeat for an SNR of -16 dB Note that the two sinusoids are hard to distinguish at the higher C16 dB) noise level. 9. Use the MATLAB Fourier transform routine to find the spectrum of a waveform consisting of two sinusoids at the 200 and 400-Hz. First generate the waveform in a 512-point array assuming a sampling frequency of 1 kHz. Take the Fourier transform of the waveform and plot the magnitude of the full spectrum (ie.. 512 points). Generate a frequency vector as in Example 3.10 so the spectrum plot has a properly scaled horizontal axis. Since the DC term will be zero, there is no need to plot it. Hint: To generate the waveform, first construct a time vector t, then generate the signal using the code: x sin(2*pi*f1*t)+sin (2*pi*f2't) 10. se the routine sig noise to generate a waveform containing 200- and 400-Hz sine waves as in Problem 9 but add noise so that the signal-to-noise ratio (SNR) is 8 dB ie.. x sig noise(1200 400], -8,N) where N 512. 271 Plot the magnitude spectrum but only plot the nonredundant points (2 to N/2) and do not plot the DC term, which again is zero. Repeat for an SNR of -16 dB Note that the two sinusoids are hard to distinguish at the higher C16 dB) noise level
Step by Step Solution
There are 3 Steps involved in it

Get step-by-step solutions from verified subject matter experts