

Question: Use the same scales to construct modified boxplots for the pulse rates of males and females from the accompanying data sets. Identify any outliers.
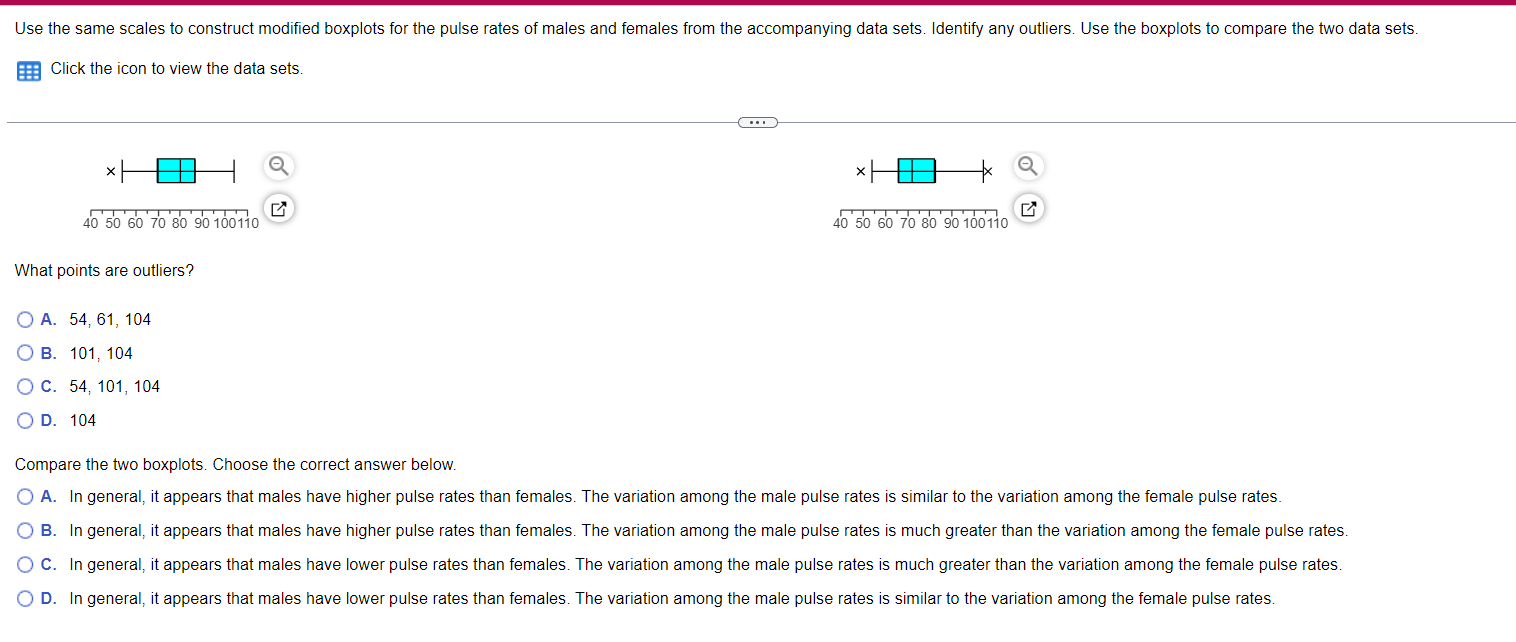
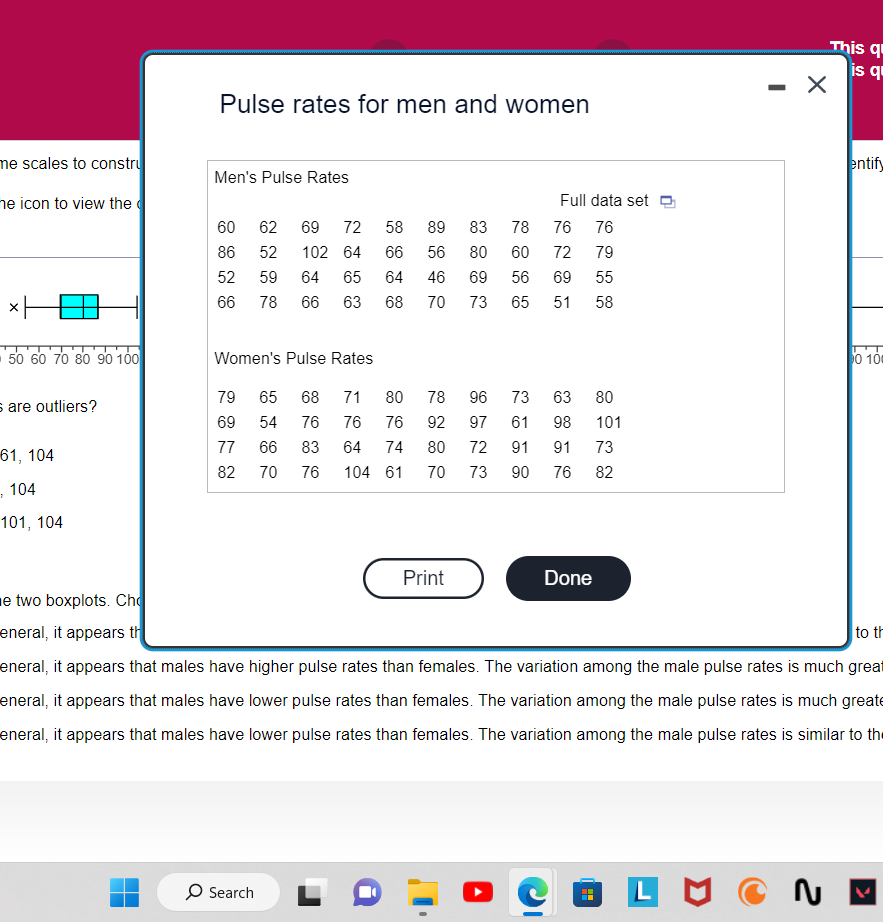
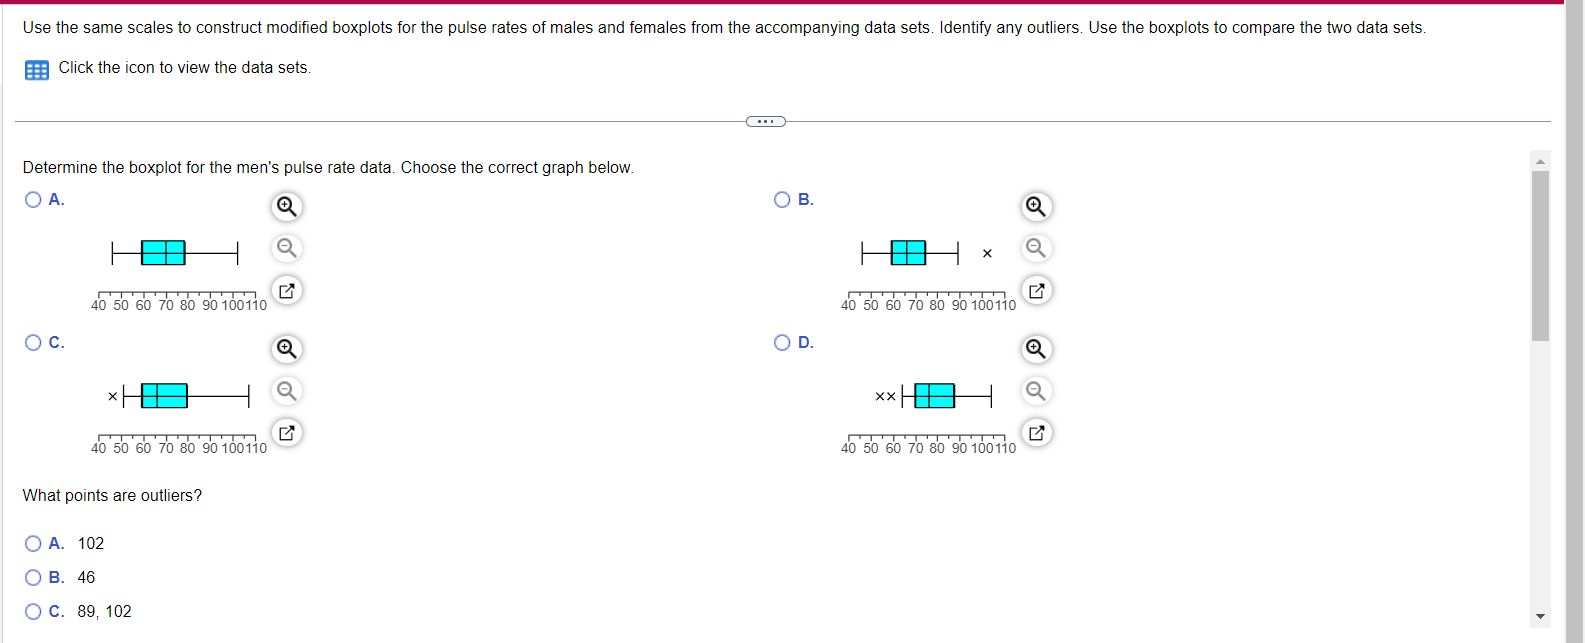
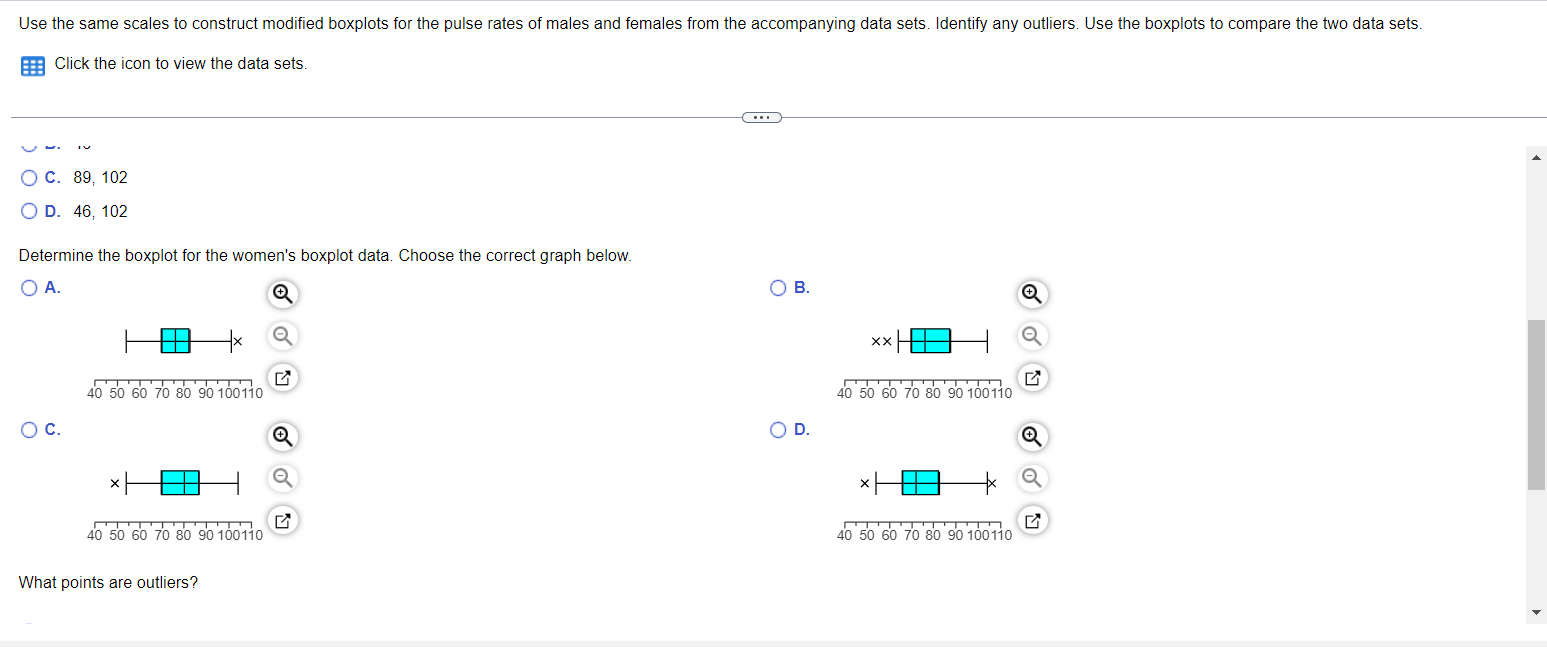
Use the same scales to construct modified boxplots for the pulse rates of males and females from the accompanying data sets. Identify any outliers. Use the boxplots to compare the two data sets. Click the icon to view the data sets. 40 50 60 70 80 90 100110 What points are outliers? A. 54, 61, 104 OB. 101, 104 OC. 54, 101, 104 D. 104 Compare the two boxplots. Choose the correct answer below. 40 50 60 70 80 90 100110 A. In general, it appears that males have higher pulse rates than females. The variation among the male pulse rates is similar to the variation among the female pulse rates. B. In general, it appears that males have higher pulse rates than females. The variation among the male pulse rates is much greater than the variation among the female pulse rates. C. In general, it appears that males have lower pulse rates than females. The variation among the male pulse rates is much greater than the variation among the female pulse rates. D. In general, it appears that males have lower pulse rates than females. The variation among the male pulse rates is similar to the variation among the female pulse rates. Pulse rates for men and women me scales to constru Men's Pulse Rates he icon to view the Full data set 60 62 86 69 72 58 89 83 78 76 76 52 102 64 66 56 80 60 72 79 52 59 64 65 64 46 69 56 69 66 78 66 63 68 70 73 65 51 55 58 - This q is q entify 0 50 60 70 80 90 100 Women's Pulse Rates 0 100 79 65 68 71 80 78 96 73 63 80 s are outliers? 69 54 76 76 76 92 97 61 98 101 77 66 83 64 74 80 72 91 91 73 61, 104 82 70 76 104 61 70 73 90 76 82 , 104 101, 104 Print Done e two boxplots. Cho eneral, it appears th to th eneral, it appears that males have higher pulse rates than females. The variation among the male pulse rates is much great eneral, it appears that males have lower pulse rates than females. The variation among the male pulse rates is much greate eneral, it appears that males have lower pulse rates than females. The variation among the male pulse rates is similar to the O Search 2 Use the same scales to construct modified boxplots for the pulse rates of males and females from the accompanying data sets. Identify any outliers. Use the boxplots to compare the two data sets. Click the icon to view the data sets. Determine the boxplot for the men's pulse rate data. Choose the correct graph below. A. C. 40 50 60 70 80 90 100110 H 40 50 60 70 80 90 100110 What points are outliers? A. 102 B. 46 C. 89, 102 B. 40 50 60 70 80 90 100110 D. 40 50 60 70 80 90 100110 Use the same scales to construct modified boxplots for the pulse rates of males and females from the accompanying data sets. Identify any outliers. Use the boxplots to compare the two data sets. Click the icon to view the data sets. IV C. 89, 102 O D. 46, 102 Determine the boxplot for the women's boxplot data. Choose the correct graph below. A. C. 40 50 60 70 80 90 100110 40 50 60 70 80 90 100110 What points are outliers? B. D. XX 40 50 60 70 80 90 100110 40 50 60 70 80 90 100110
Step by Step Solution
There are 3 Steps involved in it

Get step-by-step solutions from verified subject matter experts