

Question: Use the scatterplot to answer the question Fahrenheit Average Annual Temperature in degrees 90 increase 80 70 60 50 40 30 10 20 30 40

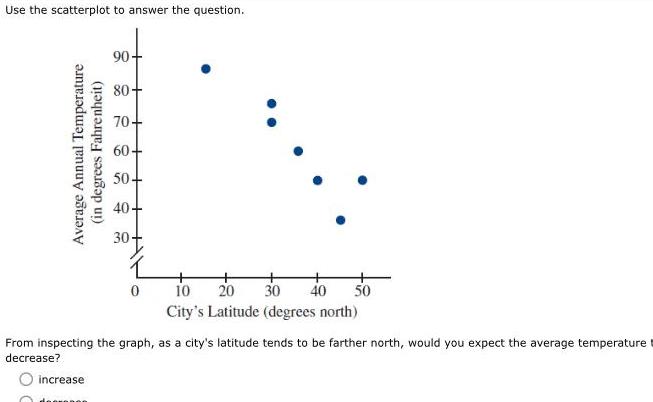
Use the scatterplot to answer the question Fahrenheit Average Annual Temperature in degrees 90 increase 80 70 60 50 40 30 10 20 30 40 50 City s Latitude degrees north From inspecting the graph as a city s latitude tends to be farther north would you expect the average temperature decrease
Step by Step Solution
There are 3 Steps involved in it
1 Expert Approved Answer
Step: 1 Unlock

Question Has Been Solved by an Expert!
Get step-by-step solutions from verified subject matter experts
Step: 2 Unlock
Step: 3 Unlock