

Question: Use the Spreadsheet 6.6 as downloaded from Canvas and change only the following variables to the new data: . Expected Return Stocks, E(rs): 14% Standard
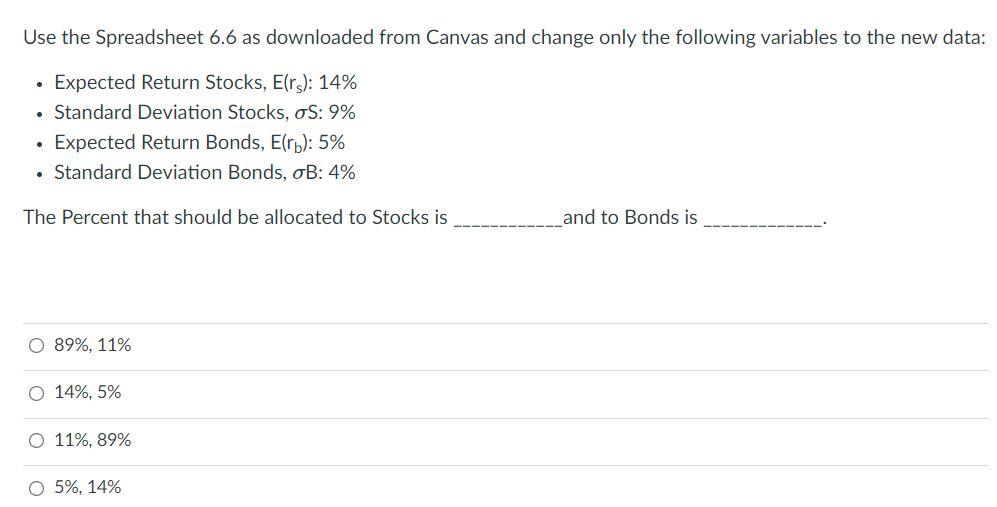
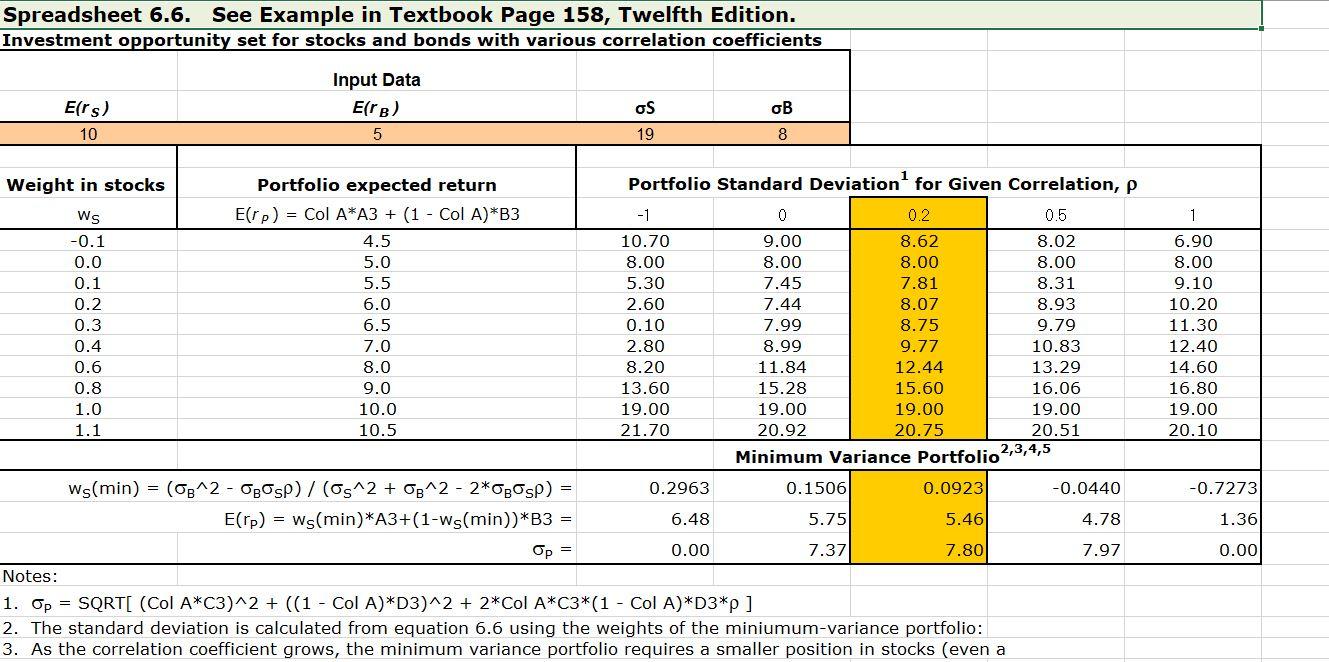
Use the Spreadsheet 6.6 as downloaded from Canvas and change only the following variables to the new data: . Expected Return Stocks, E(rs): 14% Standard Deviation Stocks, OS: 9% Expected Return Bonds, Elrb): 5% Standard Deviation Bonds, oB: 4% . . The Percent that should be allocated to Stocks is and to Bonds is O 89%, 11% O 14%, 5% O 11%, 89% O 5%, 14% Spreadsheet 6.6. See Example in Textbook Page 158, Twelfth Edition. Investment opportunity set for stocks and bonds with various correlation coefficients Input Data ErB) 5 OS Ers) 10 OB 19 8 -0.1 Weight in stocks Portfolio expected return Portfolio Standard Deviation for Given Correlation, p Ws Erp) = Col A*A3 + (1 - Col A)*B3 -1 0 0.2 0.5 4.5 10.70 9.00 8.62 8.02 0.0 5.0 8.00 8.00 8.00 8.00 0.1 5.5 5.30 7.45 7.81 8.31 0.2 6.0 2.60 7.44 8.07 8.93 0.3 6.5 0.10 7.99 8.75 9.79 0.4 7.0 2.80 8.99 9.77 10.83 0.6 8.0 8.20 11.84 12.44 13.29 0.8 9.0 13.60 15.28 15.60 16.06 1.0 19.00 19.00 19.00 19.00 1.1 10.5 21.70 20.92 20.75 20.51 Minimum Variance Portfolio 2,3,4,5 ws(min) = (3^2 - OgOsp)/(s^2 + 08^2 - 2*OBOSP) 0.2963 0.1506 0.0923 -0.0440 E(rp) = ws(min)*A3+(1-ws(min))*B3 6.48 5.75 5.46 4.78 Op = 0.00 7.37 7.80 7.97 Notes: 1. Op = SQRT[ (Col A*C3)^2 + ((1 - Col A)*D3)^2 + 2*Col A*C3*(1 - Col A)*D3*p ] 2. The standard deviation is calculated from equation 6.6 using the weights of the miniumum-variance portfolio: 3. As the correlation coefficient grows, the minimum variance portfolio requires a smaller position in stocks (even a 1 6.90 8.00 9.10 10.20 11.30 12.40 14.60 16.80 19.00 20.10 10.0 -0.7273 1.36 0.00 Use the Spreadsheet 6.6 as downloaded from Canvas and change only the following variables to the new data: . Expected Return Stocks, E(rs): 14% Standard Deviation Stocks, OS: 9% Expected Return Bonds, Elrb): 5% Standard Deviation Bonds, oB: 4% . . The Percent that should be allocated to Stocks is and to Bonds is O 89%, 11% O 14%, 5% O 11%, 89% O 5%, 14% Spreadsheet 6.6. See Example in Textbook Page 158, Twelfth Edition. Investment opportunity set for stocks and bonds with various correlation coefficients Input Data ErB) 5 OS Ers) 10 OB 19 8 -0.1 Weight in stocks Portfolio expected return Portfolio Standard Deviation for Given Correlation, p Ws Erp) = Col A*A3 + (1 - Col A)*B3 -1 0 0.2 0.5 4.5 10.70 9.00 8.62 8.02 0.0 5.0 8.00 8.00 8.00 8.00 0.1 5.5 5.30 7.45 7.81 8.31 0.2 6.0 2.60 7.44 8.07 8.93 0.3 6.5 0.10 7.99 8.75 9.79 0.4 7.0 2.80 8.99 9.77 10.83 0.6 8.0 8.20 11.84 12.44 13.29 0.8 9.0 13.60 15.28 15.60 16.06 1.0 19.00 19.00 19.00 19.00 1.1 10.5 21.70 20.92 20.75 20.51 Minimum Variance Portfolio 2,3,4,5 ws(min) = (3^2 - OgOsp)/(s^2 + 08^2 - 2*OBOSP) 0.2963 0.1506 0.0923 -0.0440 E(rp) = ws(min)*A3+(1-ws(min))*B3 6.48 5.75 5.46 4.78 Op = 0.00 7.37 7.80 7.97 Notes: 1. Op = SQRT[ (Col A*C3)^2 + ((1 - Col A)*D3)^2 + 2*Col A*C3*(1 - Col A)*D3*p ] 2. The standard deviation is calculated from equation 6.6 using the weights of the miniumum-variance portfolio: 3. As the correlation coefficient grows, the minimum variance portfolio requires a smaller position in stocks (even a 1 6.90 8.00 9.10 10.20 11.30 12.40 14.60 16.80 19.00 20.10 10.0 -0.7273 1.36 0.00
Step by Step Solution
There are 3 Steps involved in it

Get step-by-step solutions from verified subject matter experts