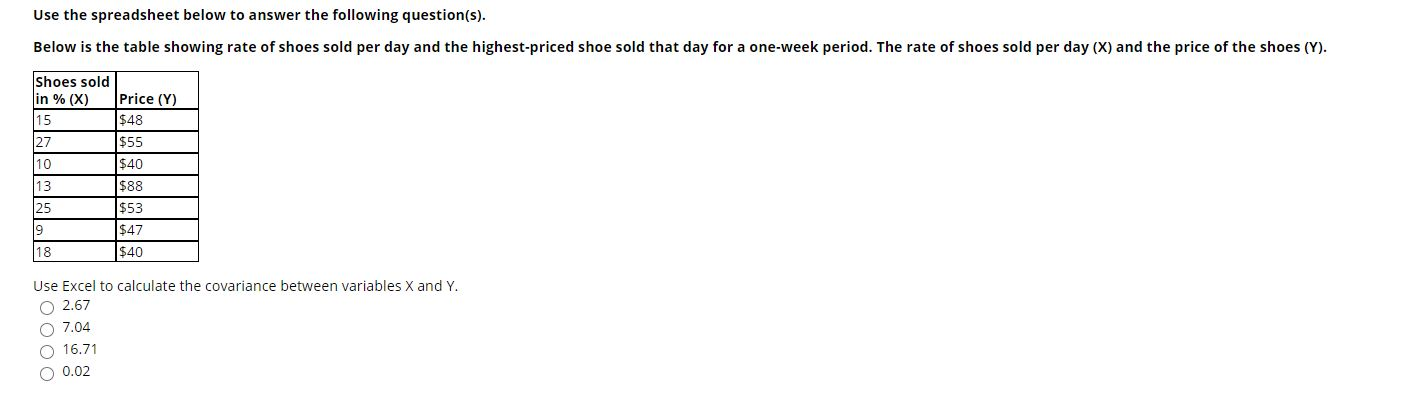
Question: Use the spreadsheet below to answer the following question(s). Below is the table showing rate of shoes sold per day and the highest-priced shoe sold

Use the spreadsheet below to answer the following

Use the spreadsheet below to answer the following question(s). Below is the table showing rate of shoes sold per day and the highest-priced shoe sold that day for a one-week period. The rate of shoes sold per day (X) and the price of the shoes (Y). Shoes sold in % (X) Price (Y) 15 $48 27 $55 10 $40 13 $88 25 $53 9 $47 18 $40 Use Excel to calculate the covariance between variables X and Y. 0 2.67 O 7.04 16.71 0 0.02

Step by Step Solution

There are 3 Steps involved in it

1 Expert Approved Answer
Step: 1 Unlock blur-text-image
Question Has Been Solved by an Expert!

Get step-by-step solutions from verified subject matter experts

Step: 2 Unlock
Step: 3 Unlock

Students Have Also Explored These Related General Management Questions!