

Question: Use the spreadsheet below to finish this assignment. You need to interpret the project progress based on the information. For this exercise, you only need
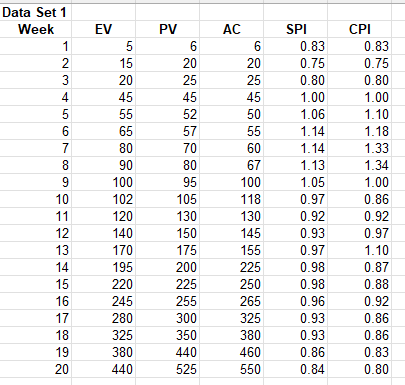
Use the spreadsheet below to finish this assignment. You need to interpret the project progress based on the information. For this exercise, you only need to look at the datasets and see how each project performs in terms of schedule and cost control. Calculating the BAC and EAC is not required. When you answer the question, please make sure that you evaluate each project separately. Thank you!
Step by Step Solution
There are 3 Steps involved in it
1 Expert Approved Answer
Step: 1 Unlock

Question Has Been Solved by an Expert!
Get step-by-step solutions from verified subject matter experts
Step: 2 Unlock
Step: 3 Unlock