

Question: Use the table below to answer questions The following table shows the closing prices of two stocks over the past seven business days. Use Excel
Use the table below to answer questions
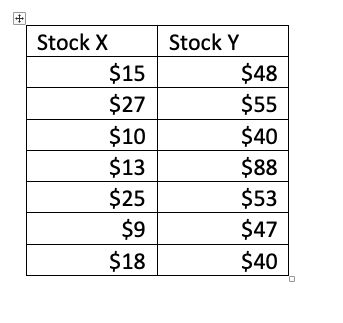
The following table shows the closing prices of two stocks over the past seven business days.
Use Excel to calculate the covariance between stock X and Y closing prices.
A) 2.67
B) 0.02
C) 16.71
D) 7.04
Use Excel to calculate the z-score of stock X observation $27.
A) -0.24
B) 0
C) 0.18
D) 1.46
Use Excel to calculate the coefficient of variation of stock X.
A) 0.42
B) 0.31
C) 7.04
D) 16.47
Use Excel to calculate the correlation between stock X and Y closing prices.
A) 16.47
B) 0.02
C) 16.71
Stock X $15 $27 $10 $13 $25 $9 $18 Stock Y $48 $55 $40 $88 $53 $47 $40
Step by Step Solution
There are 3 Steps involved in it
1 Expert Approved Answer
Step: 1 Unlock

Question Has Been Solved by an Expert!
Get step-by-step solutions from verified subject matter experts
Step: 2 Unlock
Step: 3 Unlock