

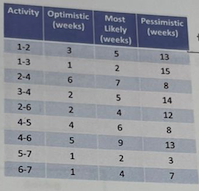
Question: Use the table below with variable times to: Draw the network diagram Identify the critical path and its duration Calculate variance of each activity Find
Use the table below with variable times to:
Draw the network diagram
Identify the critical path and its duration
Calculate variance of each activity
Find expected duration and variance of critical path
Find the probability (using z-score table) that the project will be completed in 29 weeks
Step by Step Solution
There are 3 Steps involved in it
1 Expert Approved Answer
Step: 1 Unlock

Question Has Been Solved by an Expert!
Get step-by-step solutions from verified subject matter experts
Step: 2 Unlock
Step: 3 Unlock