

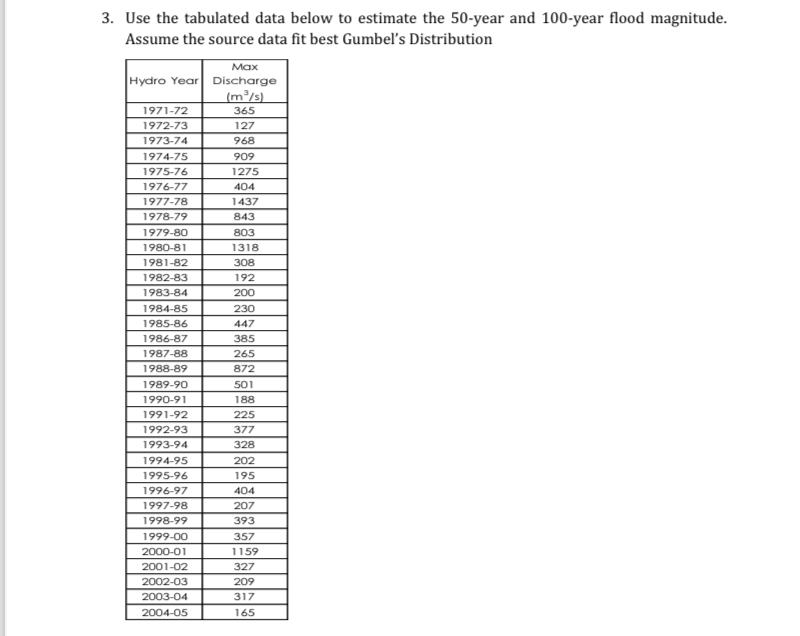
Question: Use the tabulated data below to estimate the 5 0 - year and 1 0 0 - year flood magnitude. Assume the source data fit
Use the tabulated data below to estimate the year and year flood magnitude. Assume the source data fit best Gumbel's Distribution
tableHydro Year,tableMaxDischarge
Step by Step Solution
There are 3 Steps involved in it
1 Expert Approved Answer
Step: 1 Unlock

Question Has Been Solved by an Expert!
Get step-by-step solutions from verified subject matter experts
Step: 2 Unlock
Step: 3 Unlock