

Question: Use the values and its changes to explain cost of debt (kd) and its changes from 2016 to 2020. Discuss any trends, major causes and
Use the values and its changes to explain cost of debt (kd) and its changes from 2016 to 2020. Discuss any trends, major causes and general conclusions. The table contains all the required information to answer the question.
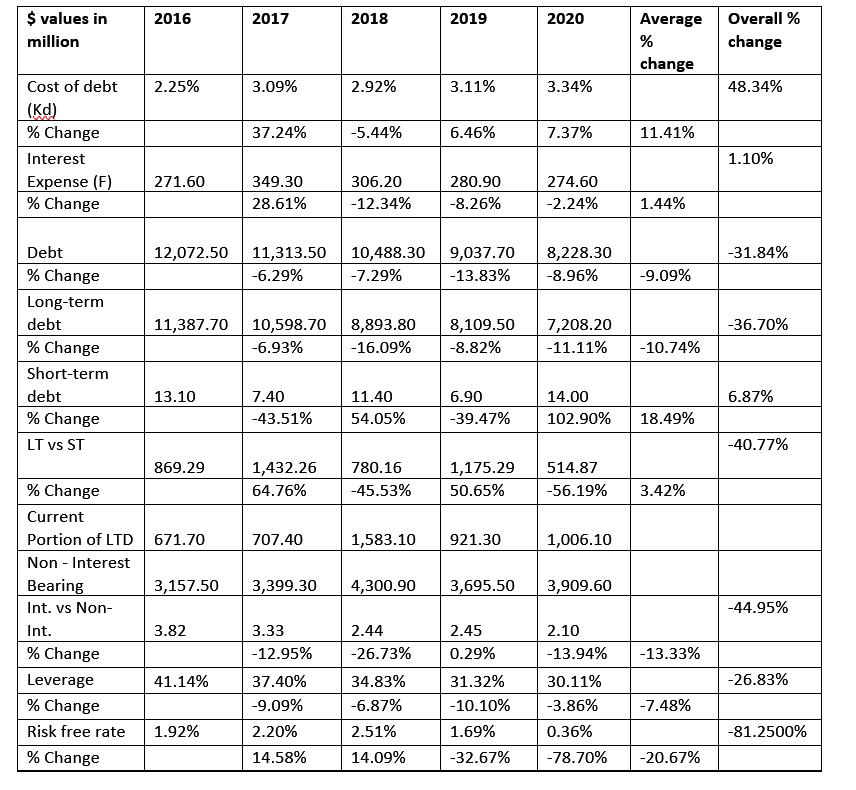
$ values in million Cost of debt (KD) % Change Interest Expense (F) % Change Debt % Change Long-term debt % Change Short-term debt % Change LT vs ST 2016 Bearing Int. vs Non- Int. % Change 2.25% 271.60 13.10 869.29 % Change Current Portion of LTD 671.70 Non - Interest 12,072.50 11,313.50 -6.29% 3,157.50 3.82 2017 Leverage % Change Risk free rate 1.92% % Change 3.09% 41.14% 37.24% 349.30 28.61% 11,387.70 10,598.70 8,893.80 -6.93% -16.09% 7.40 -43.51% 1,432.26 64.76% 707.40 3,399.30 3.33 -12.95% 2018 37.40% -9.09% 2.20% 14.58% 2.92% -5.44% 306.20 -12.34% 10,488.30 -7.29% 11.40 54.05% 780.16 -45.53% 4,300.90 2019 2.44 -26.73% 34.83% -6.87% 2.51% 14.09% 3.11% 6.46% 280.90 -8.26% 6.90 -39.47% 1,583.10 921.30 1,175.29 50.65% 9,037.70 8,228.30 -13.83% -8.96% 8,109.50 7,208.20 -8.82% 3,695.50 2020 2.45 0.29% 3.34% 31.32% -10.10% 1.69% -32.67% 7.37% 274.60 -2.24% Average % change 1,006.10 11.41% -11.11% -10.74% 3,909.60 1.44% 14.00 102.90% 18.49% -9.09% 514.87 -56.19% 3.42% 30.11% -3.86% 0.36% -78.70% 2.10 -13.94% -13.33% -7.48% -20.67% Overall % change 48.34% 1.10% -31.84% -36.70% 6.87% -40.77% -44.95% -26.83% -81.2500%
Step by Step Solution
3.47 Rating (147 Votes )
There are 3 Steps involved in it
The cost of debt Kd is the interest rate that a company pays on its debt It is calculated as the wei... View full answer

Get step-by-step solutions from verified subject matter experts