

Question: Use the X-POSITION vs. TIME graph below to answer the following questions. Express all answers in the appropriate mks units. POSITION vs. TIME GRAPH
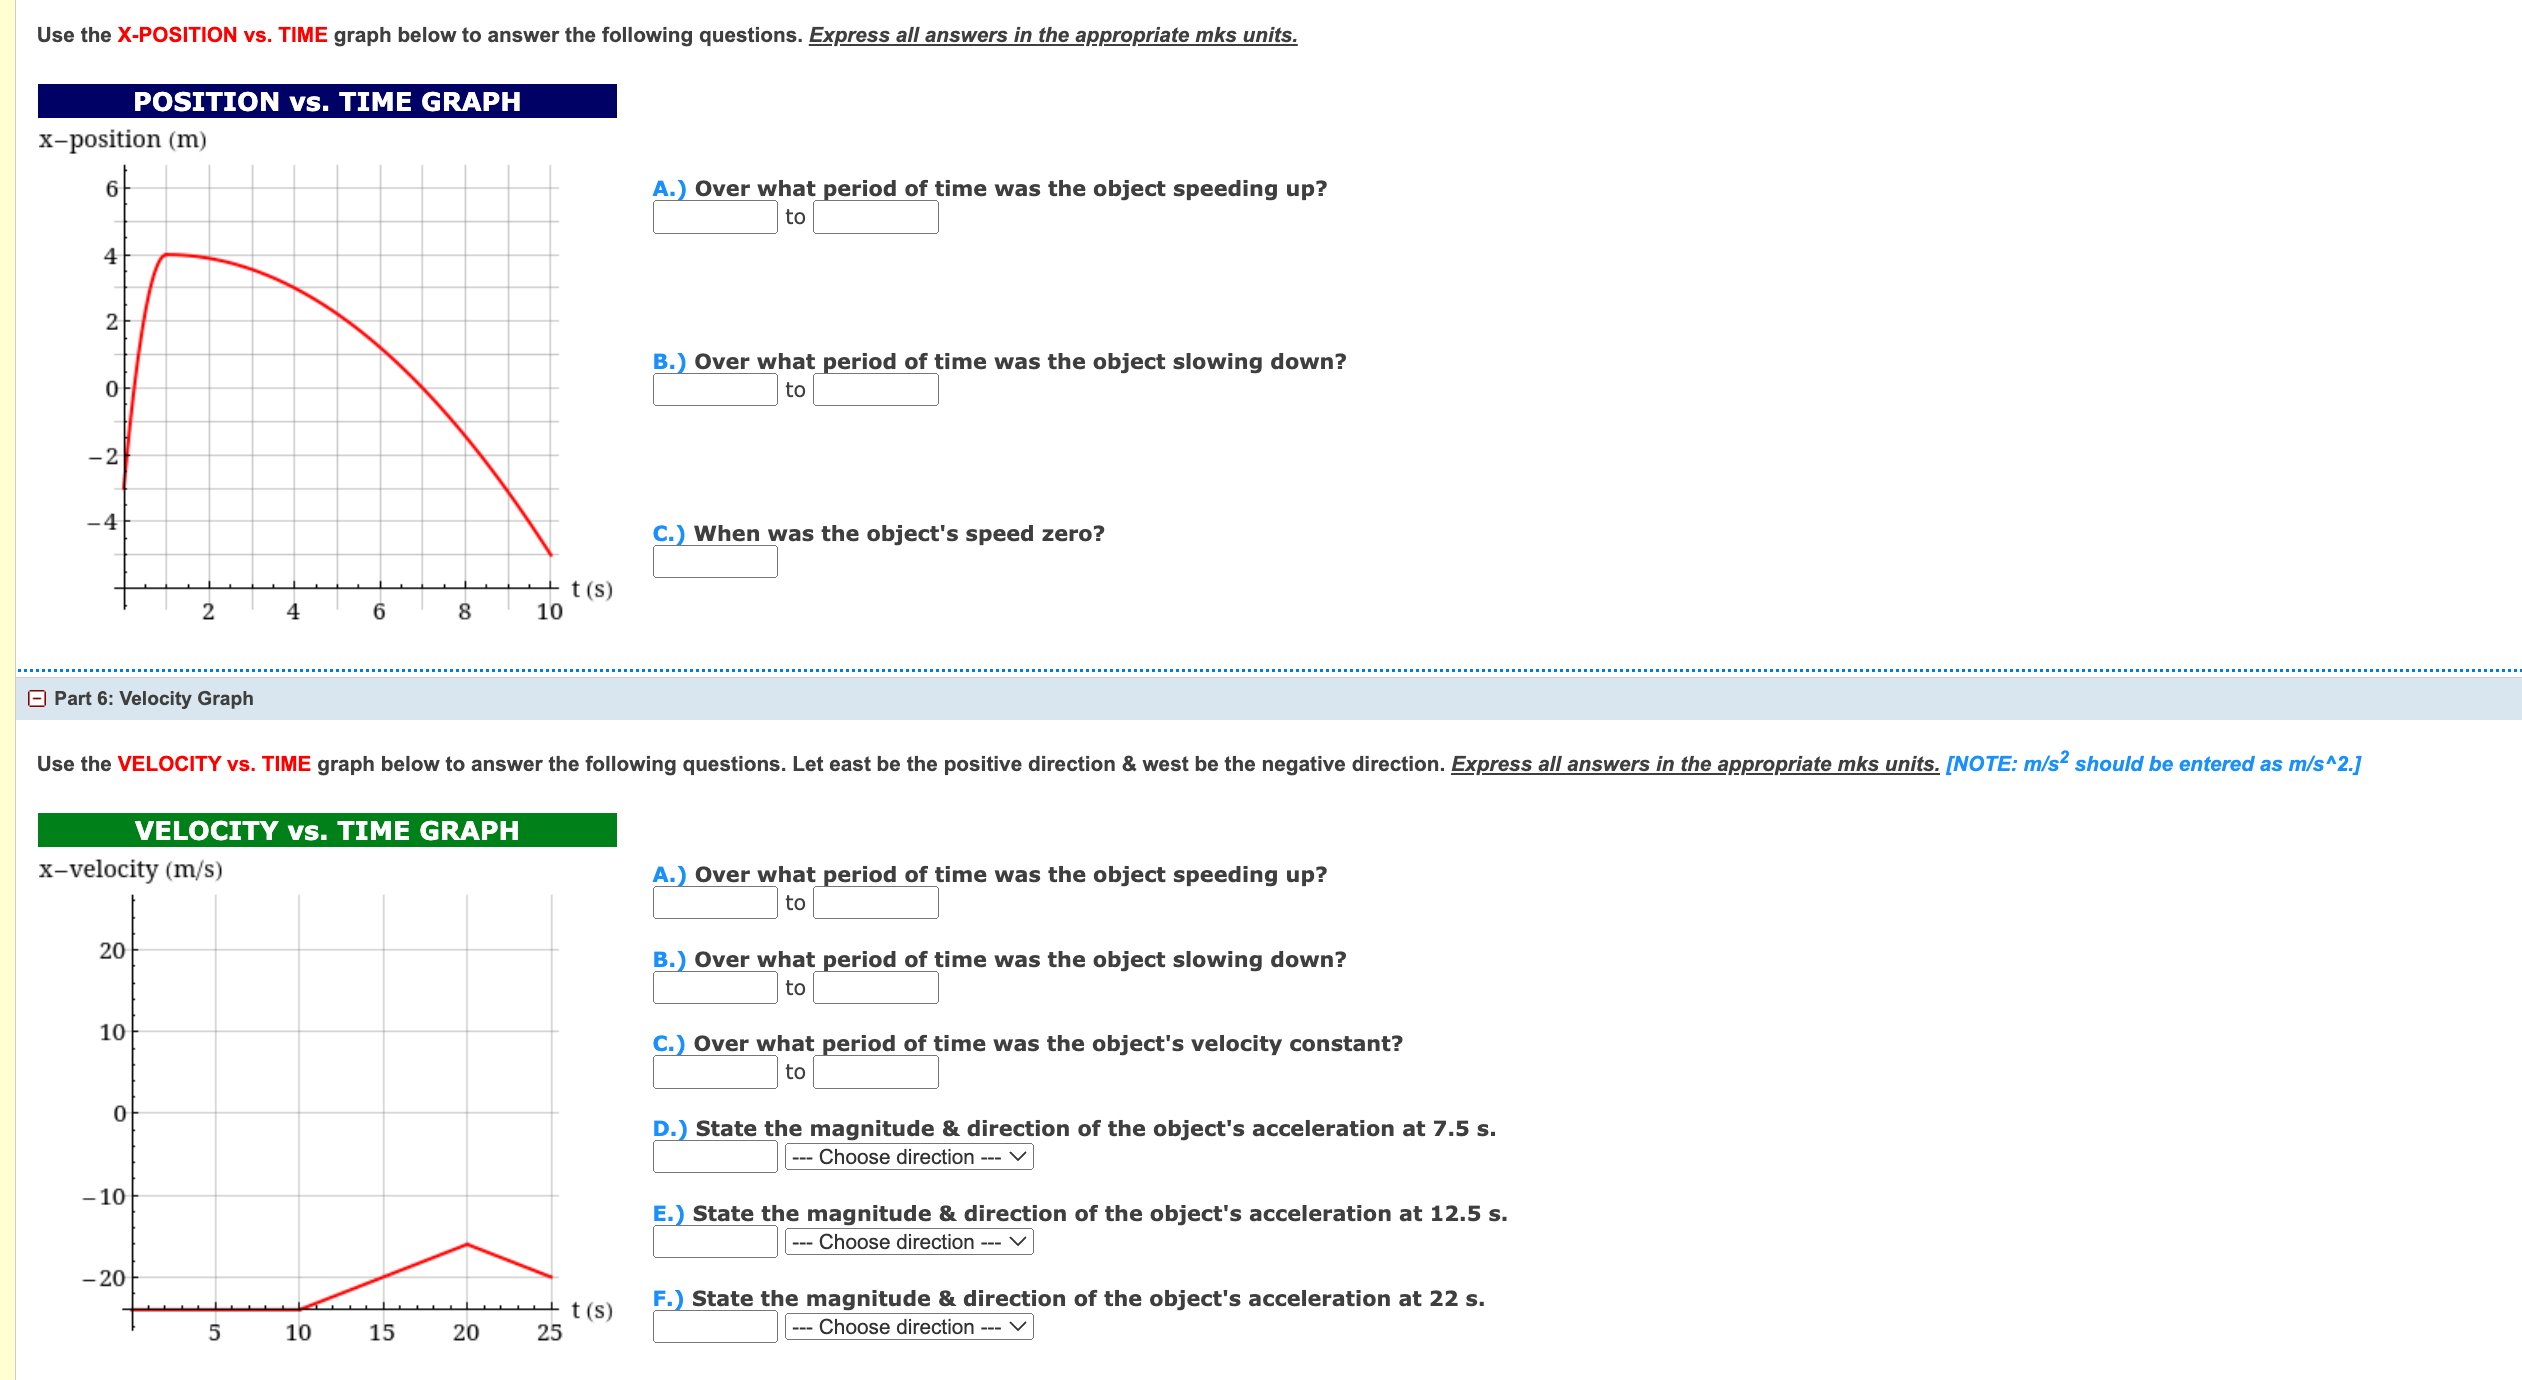
Use the X-POSITION vs. TIME graph below to answer the following questions. Express all answers in the appropriate mks units. POSITION vs. TIME GRAPH x-position (m) 6 4 2 0 -2 -4 A.) Over what period of time was the object speeding up? to B.) Over what period of time was the object slowing down? to C.) When was the object's speed zero? t(s) 2 4 6 8 10 Part 6: Velocity Graph Use the VELOCITY vs. TIME graph below to answer the following questions. Let east be the positive direction & west be the negative direction. Express all answers in the appropriate mks units. [NOTE: m/s should be entered as m/s^2.] VELOCITY vs. TIME GRAPH x-velocity (m/s) 20 10 0 -10 -20 15 15 10 5 10 20 20 A.) Over what period of time was the object speeding up? to B.) Over what period of time was the object slowing down? to C.) Over what period of time was the object's velocity constant? to 13 25 t(s) D.) State the magnitude & direction of the object's acceleration at 7.5 s. --- Choose direction --- E.) State the magnitude & direction of the object's acceleration at 12.5 s. Choose direction --- F.) State the magnitude & direction of the object's acceleration at 22 s. --- Choose direction ---
Step by Step Solution
There are 3 Steps involved in it

Get step-by-step solutions from verified subject matter experts