

Question: Use this data which you can also access by using this link to the Excel sheet to answer all of the questions in this problem
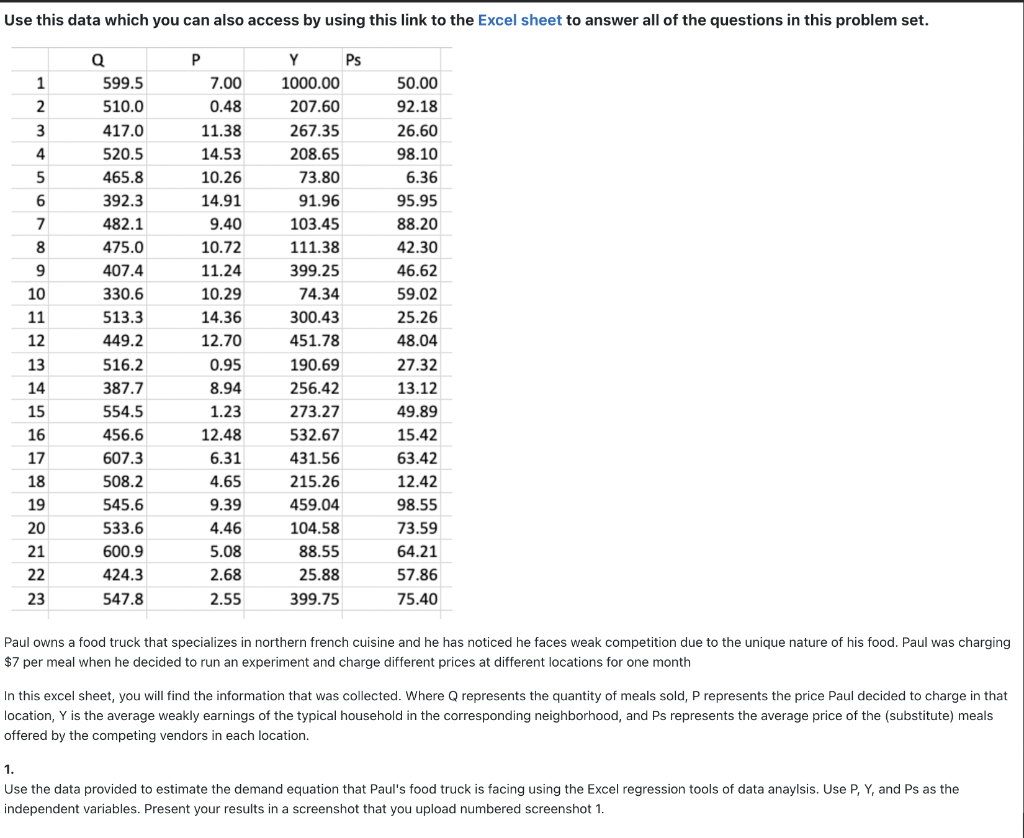
Use this data which you can also access by using this link to the Excel sheet to answer all of the questions in this problem set. P Y Ps 1 2 3 4 5 6 7 8 9 7.00 0.48 11.38 14.53 10.26 14.91 9.40 10 11 12 Q 599.5 510.0 417.0 520.5 465.8 392.3 482.1 475.0 407.4 330.6 513.3 449.2 516.2 387.7 554.5 456.6 607.3 508.2 545.6 533.6 600.9 424.3 547.8 1000.00 207.60 267.35 208.65 73.80 91.96 103.45 111.38 399.25 74.34 300.43 451.78 190.69 256.42 273.27 532.67 431.56 215.26 459.04 104.58 88.55 25.88 399.75 50.00 92.18 26.60 98.10 6.36 95.95 88.20 42.30 46.62 59.02 25.26 48.04 27.32 13.12 49.89 15.42 63.42 12.42 98.55 73.59 64.21 57.86 75.40 10.72 11.24 10.29 14.36 12.70 0.95 8.94 1.23 12.48 6.31 4.65 9.39 4.46 5.08 2.68 2.55 13 14 15 16 17 18 19 20 21 22 23 Paul owns a food truck that specializes in northern french cuisine and he has noticed he faces weak competition due to the unique nature of his food. Paul was charging $7 per meal when he decided to run an experiment and charge different prices at different locations for one month In this excel sheet, you will find the information that was collected. Where Q represents the quantity of meals sold, P represents the price Paul decided to charge in that location, Y is the average weakly earnings of the typical household in the corresponding neighborhood, and Ps represents the average price of the (substitute) meals offered by the competing vendors in each location. 1. Use the data provided to estimate the demand equation that Paul's food truck is facing using the Excel regression tools of data anaylsis. Use P, Y, and Ps as the independent variables. Present your results in a screenshot that you upload numbered screenshot 1
Step by Step Solution
There are 3 Steps involved in it

Get step-by-step solutions from verified subject matter experts