

Question: Use this sample data table to respond to tasks a-f. *Base Year Year 2013 2014* 2015 2016 Market Basket Price CPI $20 $25 $30
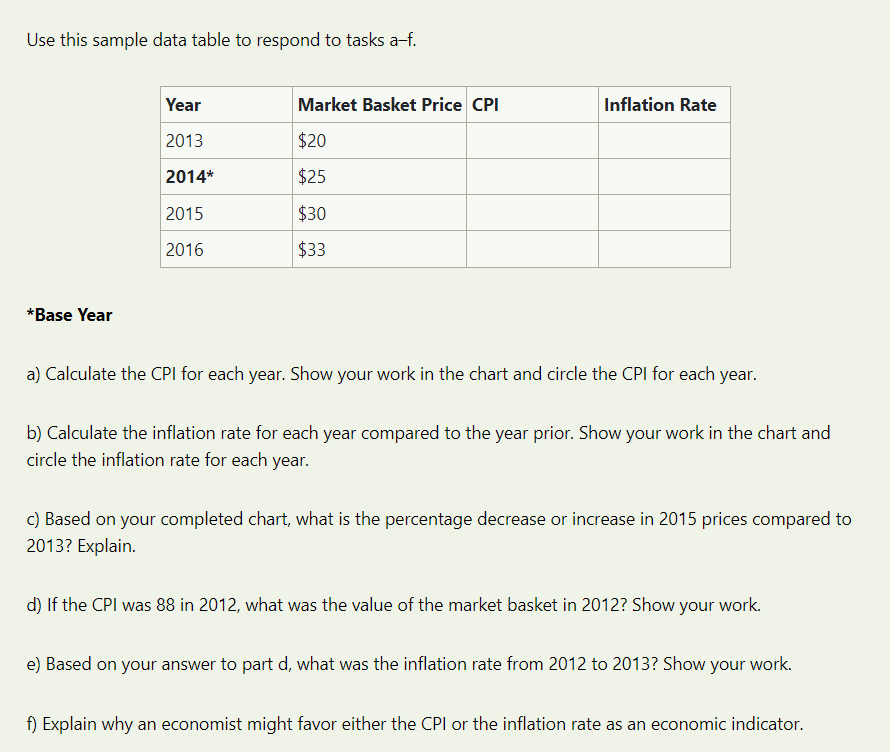
Use this sample data table to respond to tasks a-f. *Base Year Year 2013 2014* 2015 2016 Market Basket Price CPI $20 $25 $30 $33 Inflation Rate a) Calculate the CPI for each year. Show your work in the chart and circle the CPI for each year. b) Calculate the inflation rate for each year compared to the year prior. Show your work in the chart and circle the inflation rate for each year. c) Based on your completed chart, what is the percentage decrease or increase in 2015 prices compared to 2013? Explain. d) If the CPI was 88 in 2012, what was the value of the market basket in 2012? Show your work. e) Based on your answer to part d, what was the inflation rate from 2012 to 2013? Show your work. f) Explain why an economist might favor either the CPI or the inflation rate as an economic indicator.
Step by Step Solution
There are 3 Steps involved in it
f Why an economist might favor either the CPI or the inflation rate E... View full answer

Get step-by-step solutions from verified subject matter experts