Question: Use Wareenstuk data set for this problem. Costs are related to order sizes and sales. a Plot the scatter diagram of cost vs. order and
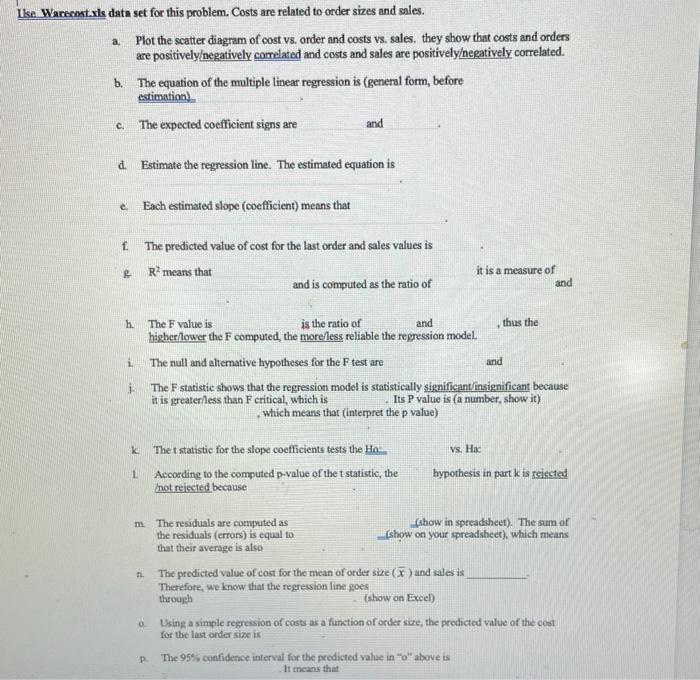
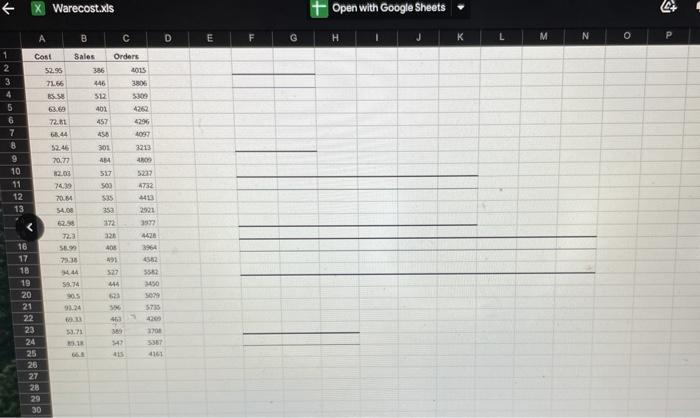
Use Wareenstuk data set for this problem. Costs are related to order sizes and sales. a Plot the scatter diagram of cost vs. order and costs vs, sales, they show that costs and orders are positively negatively corelated and costs and sales are positivelyegatively correlated. The equation of the multiple linear regression is (general form, before estimation) c. The expected coefficient signs are b. and d. Estimate the regression line. The estimated equation is e. Each estimated slope (coefficient) means that f The predicted value of cost for the last order and sales values is R? means that and is computed as the ratio of it is a measure of and h and i. and The F value is is the ratio of thus the higher/lower the F computed, the more less reliable the regression model. The null and alternative hypotheses for the F test are The F statistic shows that the regression model is statistically significant/insignificant because it is greater/less than F critical, which is . Its P value is (a number, show it) which means that interpret the p value) vs. Ha k Thet statistic for the slope coefficients tests the Ho 1 According to the computed p-value of the statistic, the not rejected because hypothesis in part k is rejected m. The residuals are computed as (show in spreadsheet). The sum of the residuals (errors) is equal to (show on your spreadsheet), which means that their average is also The predicted value of cost for the mean of order size ( ) and sales is Therefore, we know that the regression line goes through (show on Excel) a Using a simple regression of costs as a function of order size, the predicted value of the cost for the last order size is The 95% confidence interval for the predicted value in "o" above is P It means that Warecost.xls Open with Google Sheets 4+ D E F G H K M N o P 5300 A B C 1 Cont Sales Orders 2 52.95 386 ALS 3 7166 446 3806 4 $2.50 512 5 63.65 401 6 72.81 457 4296 7 6.44 458 4097 8 52.46 301 3213 9 70.77 41 10 12.03 517 5227 11 74,39 500 4732 12 2004 $35 1413 13 54.00 35a 2921 620 372 3577 72.3 321 16 59 405 3964 17 7333 191 4562 18 4 3532 19 5.4 44 1450 20 05 $23 50 21 9024 5735 22 3 23 3.71 3 24 3.18 52 25 26 27 28 29 30 > Use Wareenstuk data set for this problem. Costs are related to order sizes and sales. a Plot the scatter diagram of cost vs. order and costs vs, sales, they show that costs and orders are positively negatively corelated and costs and sales are positivelyegatively correlated. The equation of the multiple linear regression is (general form, before estimation) c. The expected coefficient signs are b. and d. Estimate the regression line. The estimated equation is e. Each estimated slope (coefficient) means that f The predicted value of cost for the last order and sales values is R? means that and is computed as the ratio of it is a measure of and h and i. and The F value is is the ratio of thus the higher/lower the F computed, the more less reliable the regression model. The null and alternative hypotheses for the F test are The F statistic shows that the regression model is statistically significant/insignificant because it is greater/less than F critical, which is . Its P value is (a number, show it) which means that interpret the p value) vs. Ha k Thet statistic for the slope coefficients tests the Ho 1 According to the computed p-value of the statistic, the not rejected because hypothesis in part k is rejected m. The residuals are computed as (show in spreadsheet). The sum of the residuals (errors) is equal to (show on your spreadsheet), which means that their average is also The predicted value of cost for the mean of order size ( ) and sales is Therefore, we know that the regression line goes through (show on Excel) a Using a simple regression of costs as a function of order size, the predicted value of the cost for the last order size is The 95% confidence interval for the predicted value in "o" above is P It means that Warecost.xls Open with Google Sheets 4+ D E F G H K M N o P 5300 A B C 1 Cont Sales Orders 2 52.95 386 ALS 3 7166 446 3806 4 $2.50 512 5 63.65 401 6 72.81 457 4296 7 6.44 458 4097 8 52.46 301 3213 9 70.77 41 10 12.03 517 5227 11 74,39 500 4732 12 2004 $35 1413 13 54.00 35a 2921 620 372 3577 72.3 321 16 59 405 3964 17 7333 191 4562 18 4 3532 19 5.4 44 1450 20 05 $23 50 21 9024 5735 22 3 23 3.71 3 24 3.18 52 25 26 27 28 29 30 >