

Question: Use your data set and summary statistics from Part 1 of the Project, to answer the following questions. Put your results in a semi-professional looking
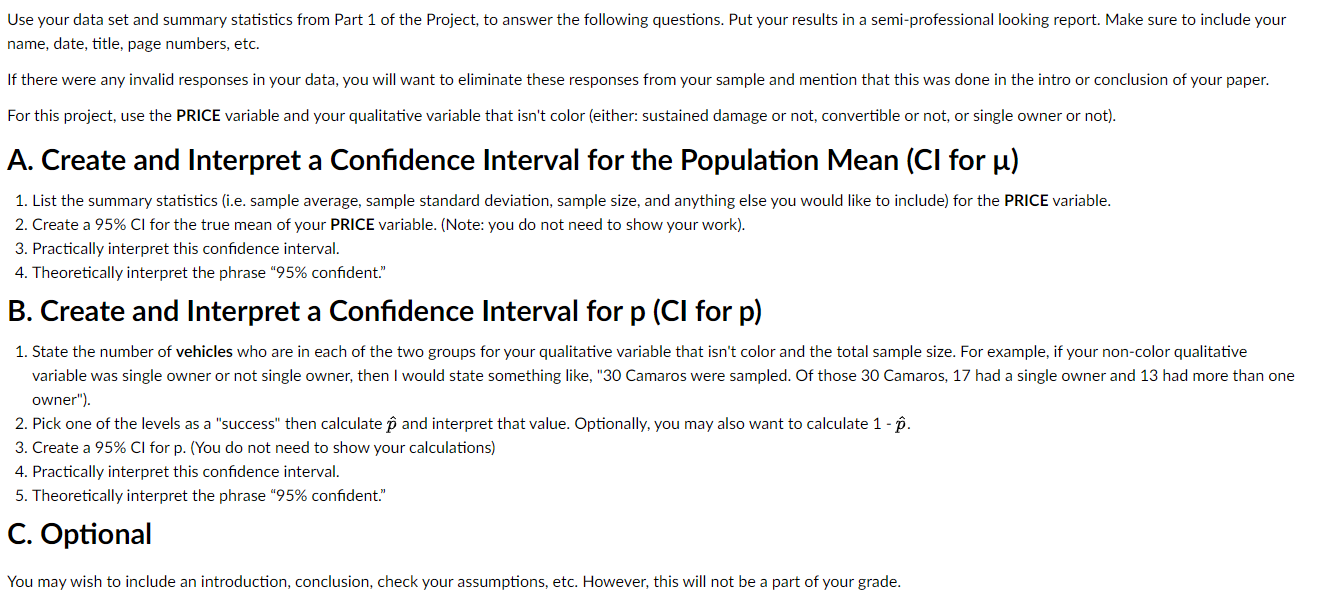
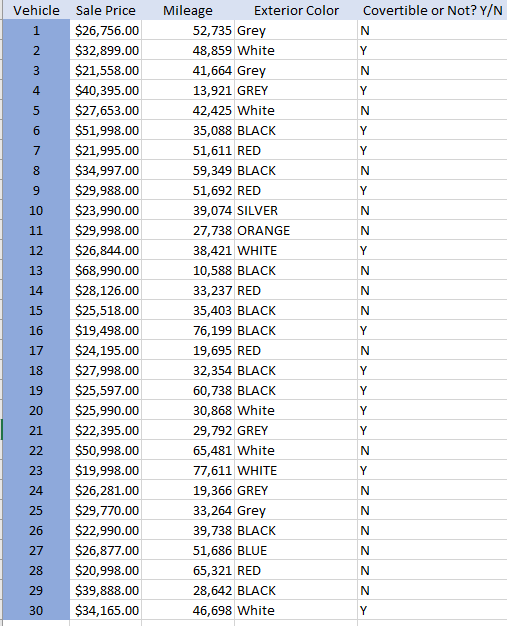
Use your data set and summary statistics from Part 1 of the Project, to answer the following questions. Put your results in a semi-professional looking report. Make sure to include your name, date, title, page numbers, etc. If there were any invalid responses in your data, you will want to eliminate these responses from your sample and mention that this was done in the intro or conclusion of your paper. For this project, use the PRICE variable and your qualitative variable that isn't color (either: sustained damage or not, convertible or not, or single owner or not). A. Create and Interpret a Confidence Interval for the Population Mean (CI for ) 1. List the summary statistics (i.e. sample average, sample standard deviation, sample size, and anything else you would like to include) for the PRICE variable. 2. Create a 95%Cl for the true mean of your PRICE variable. (Note: you do not need to show your work). 3. Practically interpret this confidence interval. 4. Theoretically interpret the phrase "95\% confident." B. Create and Interpret a Confidence Interval for p (Cl for p) 1. State the number of vehicles who are in each of the two groups for your qualitative variable that isn't color and the total sample size. For example, if your non-color qualitative variable was single owner or not single owner, then I would state something like, "30 Camaros were sampled. Of those 30 Camaros, 17 had a single owner and 13 had more than one owner"). 2. Pick one of the levels as a "success" then calculate p^ and interpret that value. Optionally, you may also want to calculate 1p^. 3. Create a 95%Cl for p. (You do not need to show your calculations) 4. Practically interpret this confidence interval. 5. Theoretically interpret the phrase "95\% confident." \begin{tabular}{|r|r|l|l|l|l|} \hline Vehicle & Sale Price & Mileage & Exterior Color & Covertible or Not? Y/N \\ \hline 1 & $26,756.00 & 52,735 Grey & N \\ \hline 2 & $32,899.00 & 48,859 White & Y \\ \hline 3 & $21,558.00 & 41,664 Grey & N \\ \hline 4 & $40,395.00 & 13,921 GREY & Y \\ \hline 5 & $27,653.00 & 42,425 White & N \\ \hline 6 & $51,998.00 & 35,088 BLACK & Y \\ \hline & $21,995.00 & 51,611 RED & Y \\ \hline 8 & $34,997.00 & 59,349 BLACK & N \\ \hline 9 & $29,988.00 & 51,692 RED & Y \\ \hline 10 & $23,990.00 & 39,074 SILVER & N \\ \hline 11 & $29,998.00 & 27,738 ORANGE & N \\ \hline 12 & $26,844.00 & 38,421 WHITE & Y \\ \hline 13 & $68,990.00 & 10,588 BLACK & N \\ \hline 14 & $28,126.00 & 33,237 RED & N \\ \hline 15 & $25,518.00 & 35,403 BLACK & N \\ \hline 16 & $19,498.00 & 76,199 BLACK & Y \\ \hline 17 & $24,195.00 & 19,695 RED & N \\ \hline 18 & $27,998.00 & 32,354 BLACK & Y \\ \hline 19 & $25,597.00 & 60,738 BLACK & Y \\ \hline 20 & $25,990.00 & 30,868 White & Y \\ \hline 21 & $22,395.00 & 29,792 GREY & Y \\ \hline 22 & $50,998.00 & 65,481 White & N \\ \hline 23 & $19,998.00 & 77,611 WHITE & Y \\ \hline 24 & $26,281.00 & 19,366 GREY & N \\ \hline 25 & $29,770.00 & 33,264 Grey & N \\ \hline 26 & $22,990.00 & 39,738 BLACK & N \\ \hline 27 & $26,877.00 & 51,686 BLUE & N \\ \hline 28 & $20,998.00 & 65,321 RED & N \\ \hline 29 & $39,888.00 & 28,642 BLACK & N \\ \hline 30 & $34,165.00 & 46,698 White & Y \\ \hline \end{tabular} Use your data set and summary statistics from Part 1 of the Project, to answer the following questions. Put your results in a semi-professional looking report. Make sure to include your name, date, title, page numbers, etc. If there were any invalid responses in your data, you will want to eliminate these responses from your sample and mention that this was done in the intro or conclusion of your paper. For this project, use the PRICE variable and your qualitative variable that isn't color (either: sustained damage or not, convertible or not, or single owner or not). A. Create and Interpret a Confidence Interval for the Population Mean (CI for ) 1. List the summary statistics (i.e. sample average, sample standard deviation, sample size, and anything else you would like to include) for the PRICE variable. 2. Create a 95%Cl for the true mean of your PRICE variable. (Note: you do not need to show your work). 3. Practically interpret this confidence interval. 4. Theoretically interpret the phrase "95\% confident." B. Create and Interpret a Confidence Interval for p (Cl for p) 1. State the number of vehicles who are in each of the two groups for your qualitative variable that isn't color and the total sample size. For example, if your non-color qualitative variable was single owner or not single owner, then I would state something like, "30 Camaros were sampled. Of those 30 Camaros, 17 had a single owner and 13 had more than one owner"). 2. Pick one of the levels as a "success" then calculate p^ and interpret that value. Optionally, you may also want to calculate 1p^. 3. Create a 95%Cl for p. (You do not need to show your calculations) 4. Practically interpret this confidence interval. 5. Theoretically interpret the phrase "95\% confident." \begin{tabular}{|r|r|l|l|l|l|} \hline Vehicle & Sale Price & Mileage & Exterior Color & Covertible or Not? Y/N \\ \hline 1 & $26,756.00 & 52,735 Grey & N \\ \hline 2 & $32,899.00 & 48,859 White & Y \\ \hline 3 & $21,558.00 & 41,664 Grey & N \\ \hline 4 & $40,395.00 & 13,921 GREY & Y \\ \hline 5 & $27,653.00 & 42,425 White & N \\ \hline 6 & $51,998.00 & 35,088 BLACK & Y \\ \hline & $21,995.00 & 51,611 RED & Y \\ \hline 8 & $34,997.00 & 59,349 BLACK & N \\ \hline 9 & $29,988.00 & 51,692 RED & Y \\ \hline 10 & $23,990.00 & 39,074 SILVER & N \\ \hline 11 & $29,998.00 & 27,738 ORANGE & N \\ \hline 12 & $26,844.00 & 38,421 WHITE & Y \\ \hline 13 & $68,990.00 & 10,588 BLACK & N \\ \hline 14 & $28,126.00 & 33,237 RED & N \\ \hline 15 & $25,518.00 & 35,403 BLACK & N \\ \hline 16 & $19,498.00 & 76,199 BLACK & Y \\ \hline 17 & $24,195.00 & 19,695 RED & N \\ \hline 18 & $27,998.00 & 32,354 BLACK & Y \\ \hline 19 & $25,597.00 & 60,738 BLACK & Y \\ \hline 20 & $25,990.00 & 30,868 White & Y \\ \hline 21 & $22,395.00 & 29,792 GREY & Y \\ \hline 22 & $50,998.00 & 65,481 White & N \\ \hline 23 & $19,998.00 & 77,611 WHITE & Y \\ \hline 24 & $26,281.00 & 19,366 GREY & N \\ \hline 25 & $29,770.00 & 33,264 Grey & N \\ \hline 26 & $22,990.00 & 39,738 BLACK & N \\ \hline 27 & $26,877.00 & 51,686 BLUE & N \\ \hline 28 & $20,998.00 & 65,321 RED & N \\ \hline 29 & $39,888.00 & 28,642 BLACK & N \\ \hline 30 & $34,165.00 & 46,698 White & Y \\ \hline \end{tabular}
Step by Step Solution
There are 3 Steps involved in it

Get step-by-step solutions from verified subject matter experts