

Question: Using 20-year U.S. Treasury yield as the risk free rate, the beta and the market risk premium information in the case material, what is the
Using 20-year U.S. Treasury yield as the risk free rate, the beta and the market risk premium information in the case material, what is the cost of equity capital of the company before the proposed leveraged recapitalization (hint: use the CAPM to compute the cost of equity capital)?
| 8.5% |
| 9.8% |
| 10.9% |
| 12.3% |
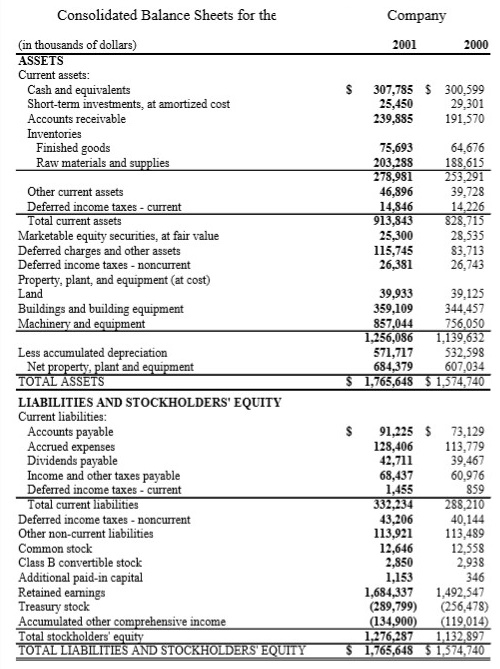
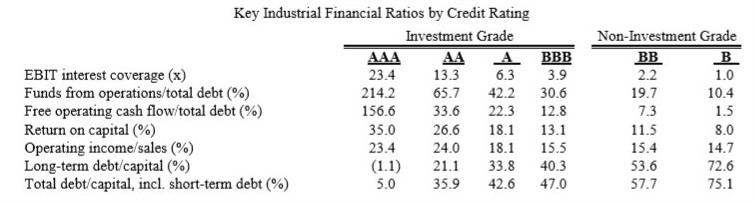
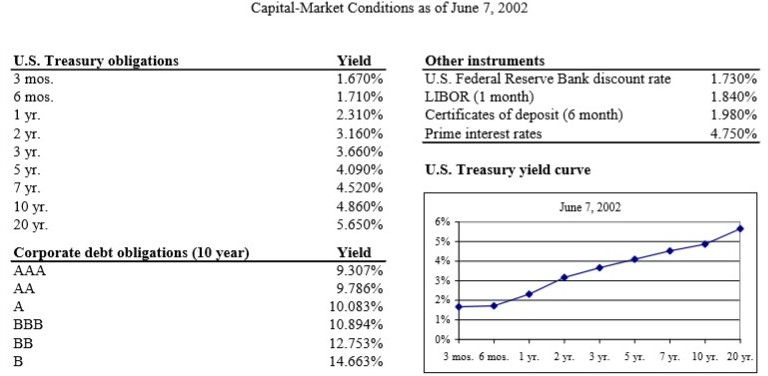
Consolidated Balance Sheets for the Company (in thousands of dollars) ASSETS Current assets: 2001 2000 Cash and equivalents Short-term investments, at amortized cost Accounts receivable Inventories S 307,785 S 300,599 29,301 239,885 191,570 25,450 75,693 203,288 278,981 46,896 14.846 913,843 25,300 115,745 26,381 64,676 188,615 Finished goods Raw materials and supplies 39,728 14.226 Other current assets Deferred income taxes current Total curent assets Marketable equity securities, at fair value Deferred charges and other assets Deferred income taxes noncurrent Property, plant, and equipment (at cost) Land Buildings and building eqpment 28,535 83,713 26,743 39,933 359,109 857.0 39,125 344,457 756.050 and e ent Less accumulated depreciation 571,717532,598 607.034 Net lant and ent 684,379 LIABILITIES AND STOCKHOLDERS' EQUITY Current liabilities: S 91,225 73,129 128,406 13,779 39,467 60,976 Accounts payable Accrued expenses Dividends payable 42,711 68,437 1.455 Income and other taxes payable Deferred income taxes current current ties Deferred income taxes noncurrent Other non-current liabilities Common stock Class B convertible stock Additional paid-in capital Retained earnings Treasury stock Accumulated other com Total stockholders' equity 40,144 13,921 113,489 12,558 2,938 346 1,684,3371,492,547 (289,799 (256,478) 119,014 1,276,287 1,132.897 43,206 12,646 2,850 1,153 ve income 134 765,64 Key Industrial Financial Ratios by Credit Rating Investment Grade Non-Investment Grade 13.3 EBIT interest coverage (x) Funds from operations/total debt (%) Free operating cash flow/total debt (%) Return on capital (%) Operating income/sales (%) Long-term debt/capital (%) Total debt/capital, incl. short-term debt (%) 23.4 214.2 156.6 35.0 23.4 6.3 3.9 65.7 42.2 30.6 33.6 22.3 12.8 26.6 18.1 13.1 24.0 18.1 15.5 (1.1) 21. 33.8 40.3 35.9 42.6 47.0 2.2 19.7 7.3 11.5 15.4 53.6 57.7 1.0 10.4 1.5 8.0 14.7 72.6 75.1 5.0 Capital-Market Conditions as of June 7, 2002 Other instruments U.S. Federal Reserve Bank discount rate LIBOR (1 month) Certificates of deposit (6 month) Prime interest rates U.S. Treasury obligations 3 mos 6 mos 1 yr 2 yr 3 yr 5 yr Yield 1.670% 1.710% 2.310% 3.160% 3.660% 4.090% 4.520% 4.860% 5.650% 1 .730% 1 .840% 1 .980% 4.750% U.S. Treasury yield curv yr 10 yr 20 yr June 7, 2002 Yield 9.307% 9.786% 10.083% 10.894% 12.753% 14.663% 6% 596 4% 3% 2% 1% 0% Corporate debt obligations (10 year 3mos. 6mos. 1. . . 5. 7yT. 10 . 20
Step by Step Solution
There are 3 Steps involved in it

Get step-by-step solutions from verified subject matter experts