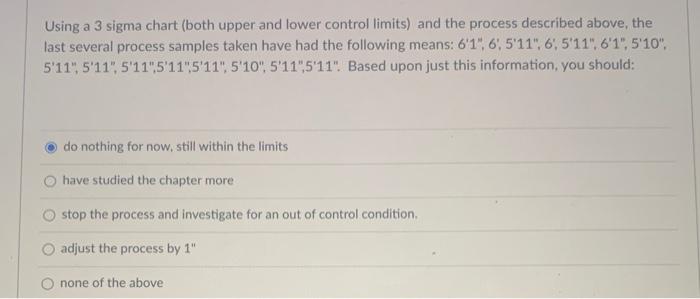
Question: Using a 3 sigma chart (both upper and lower control limits) and the process described above, the last several process samples taken have had the

Using a 3 sigma chart (both upper and lower
Using a 3 sigma chart (both upper and lower control limits) and the process described above, the last several process samples taken have had the following means: 6'1" 6,5'11" 6,5'11" 6'1" 5'10" 5'11" 5'11" 5'11"5'11"5'11" 5'10" 5'11",5'11". Based upon just this information, you should: do nothing for now, still within the limits have studied the chapter more stop the process and investigate for an out of control condition adjust the process by 1" none of the above Normally, your soda bottle capping process will miss about 5% of the bottles you intend to cap. Sigma is equal to 1%. The number defective in the last 5 samples has been observed to be: 5.4%. 5.2%, 5.1%, 2.7%, and 2.6%. Based just upon this information, you should: nothing for now, still in control nothing for now, your process is getting better drink a few, after all, with no cap. it would only go to waste stop the process and investigate for an out of control condition O none of the above

Step by Step Solution

There are 3 Steps involved in it

1 Expert Approved Answer
Step: 1 Unlock blur-text-image
Question Has Been Solved by an Expert!

Get step-by-step solutions from verified subject matter experts

Step: 2 Unlock
Step: 3 Unlock

Students Have Also Explored These Related General Management Questions!