

Question: Using a calculator or computer, generate a graph Like the one shown below by graphing y : e3z 1 and y : 33$ for %
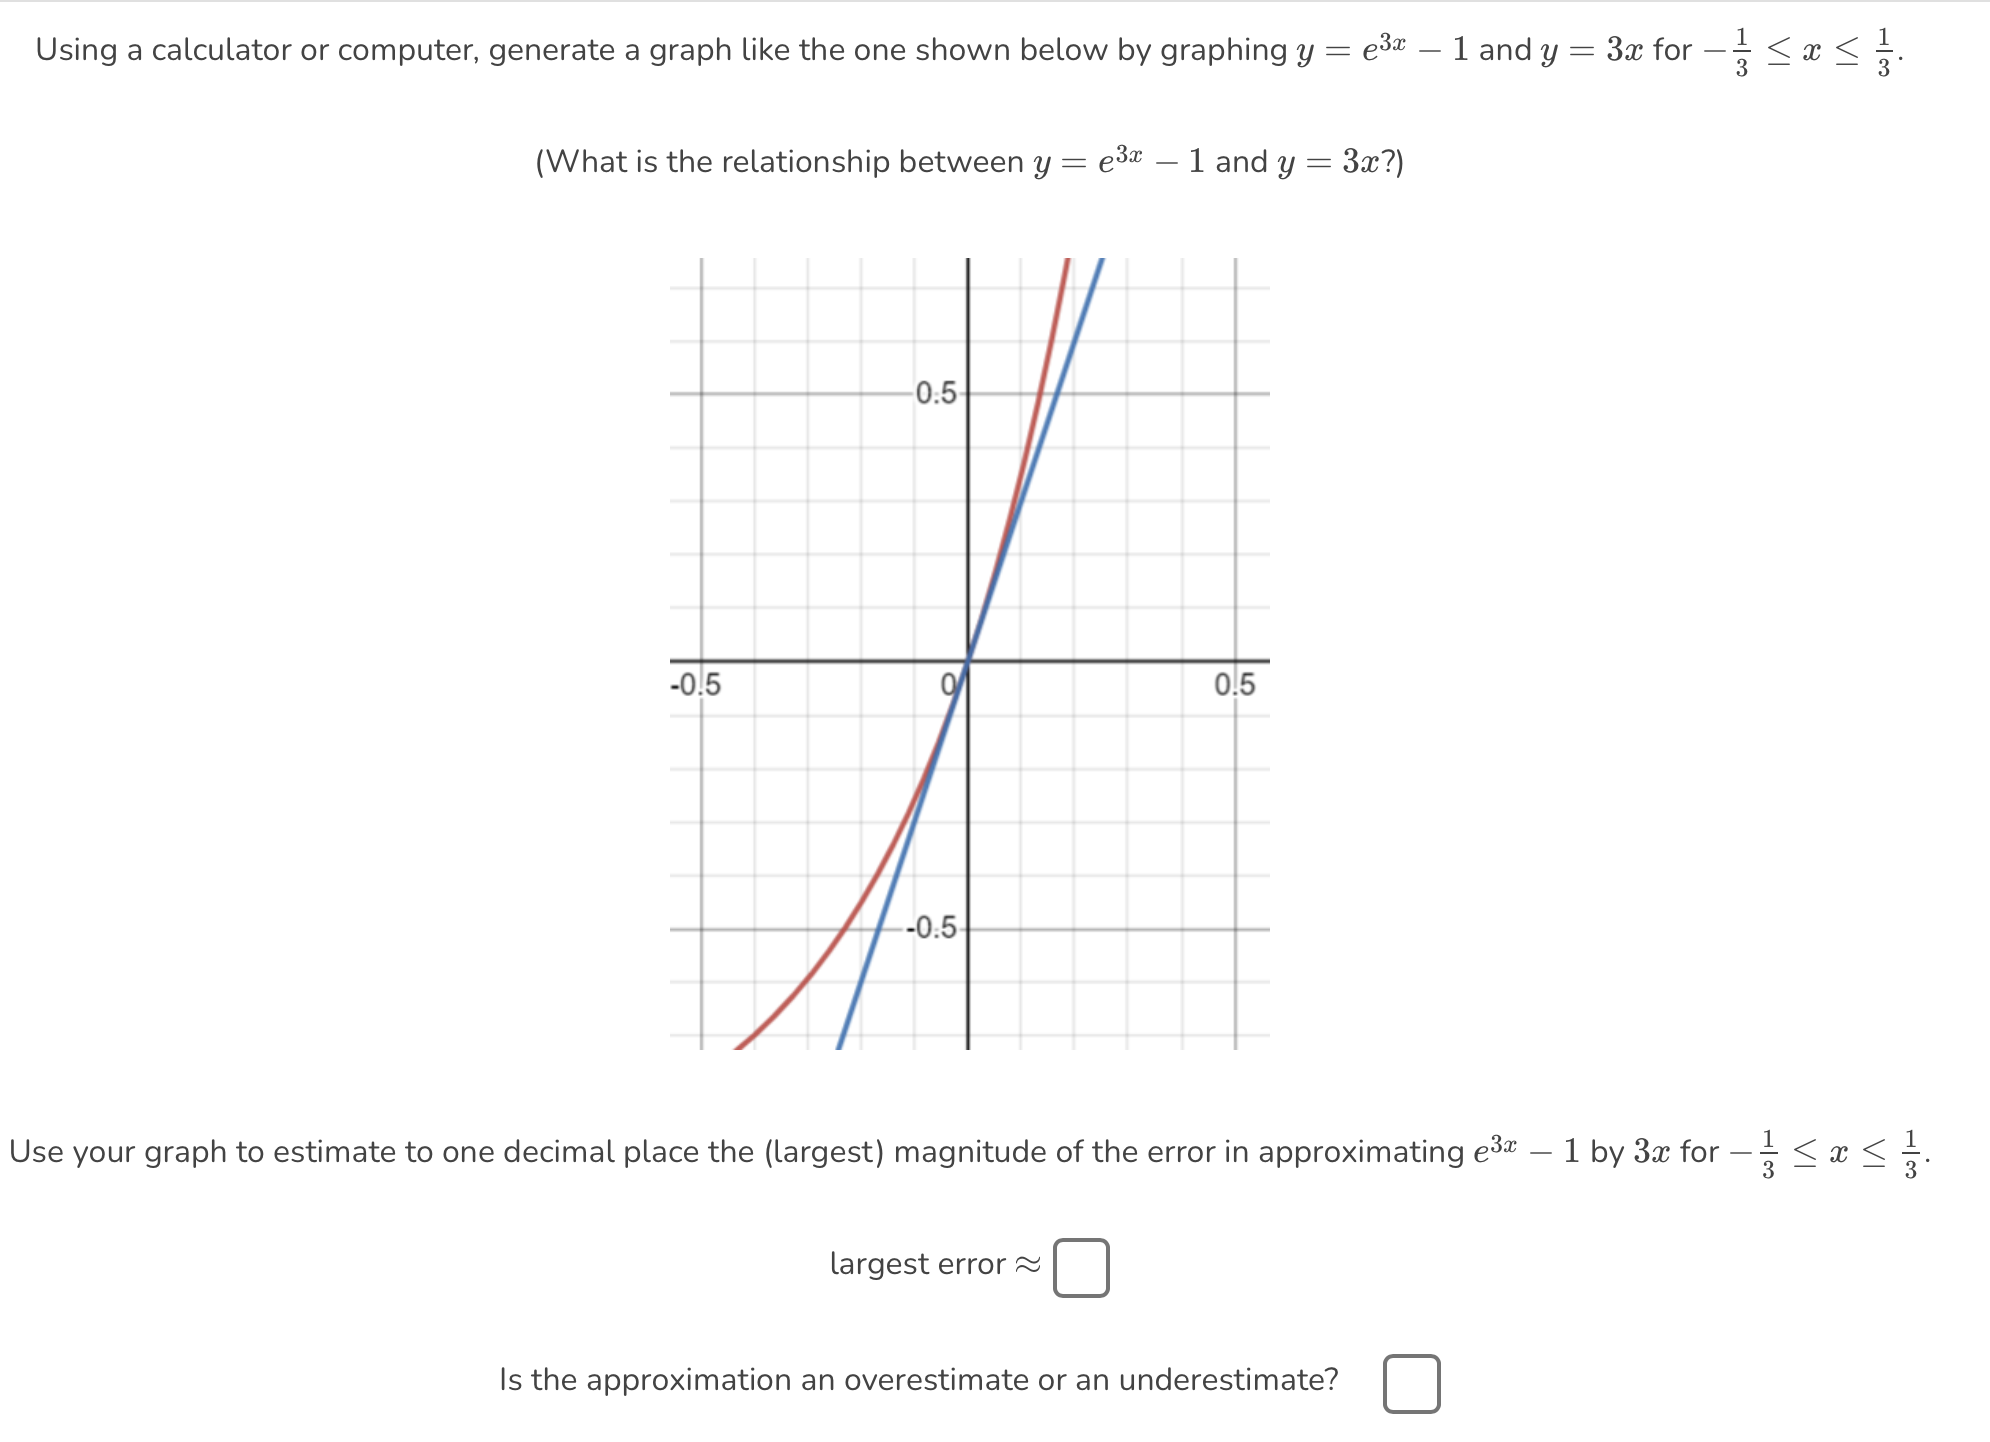
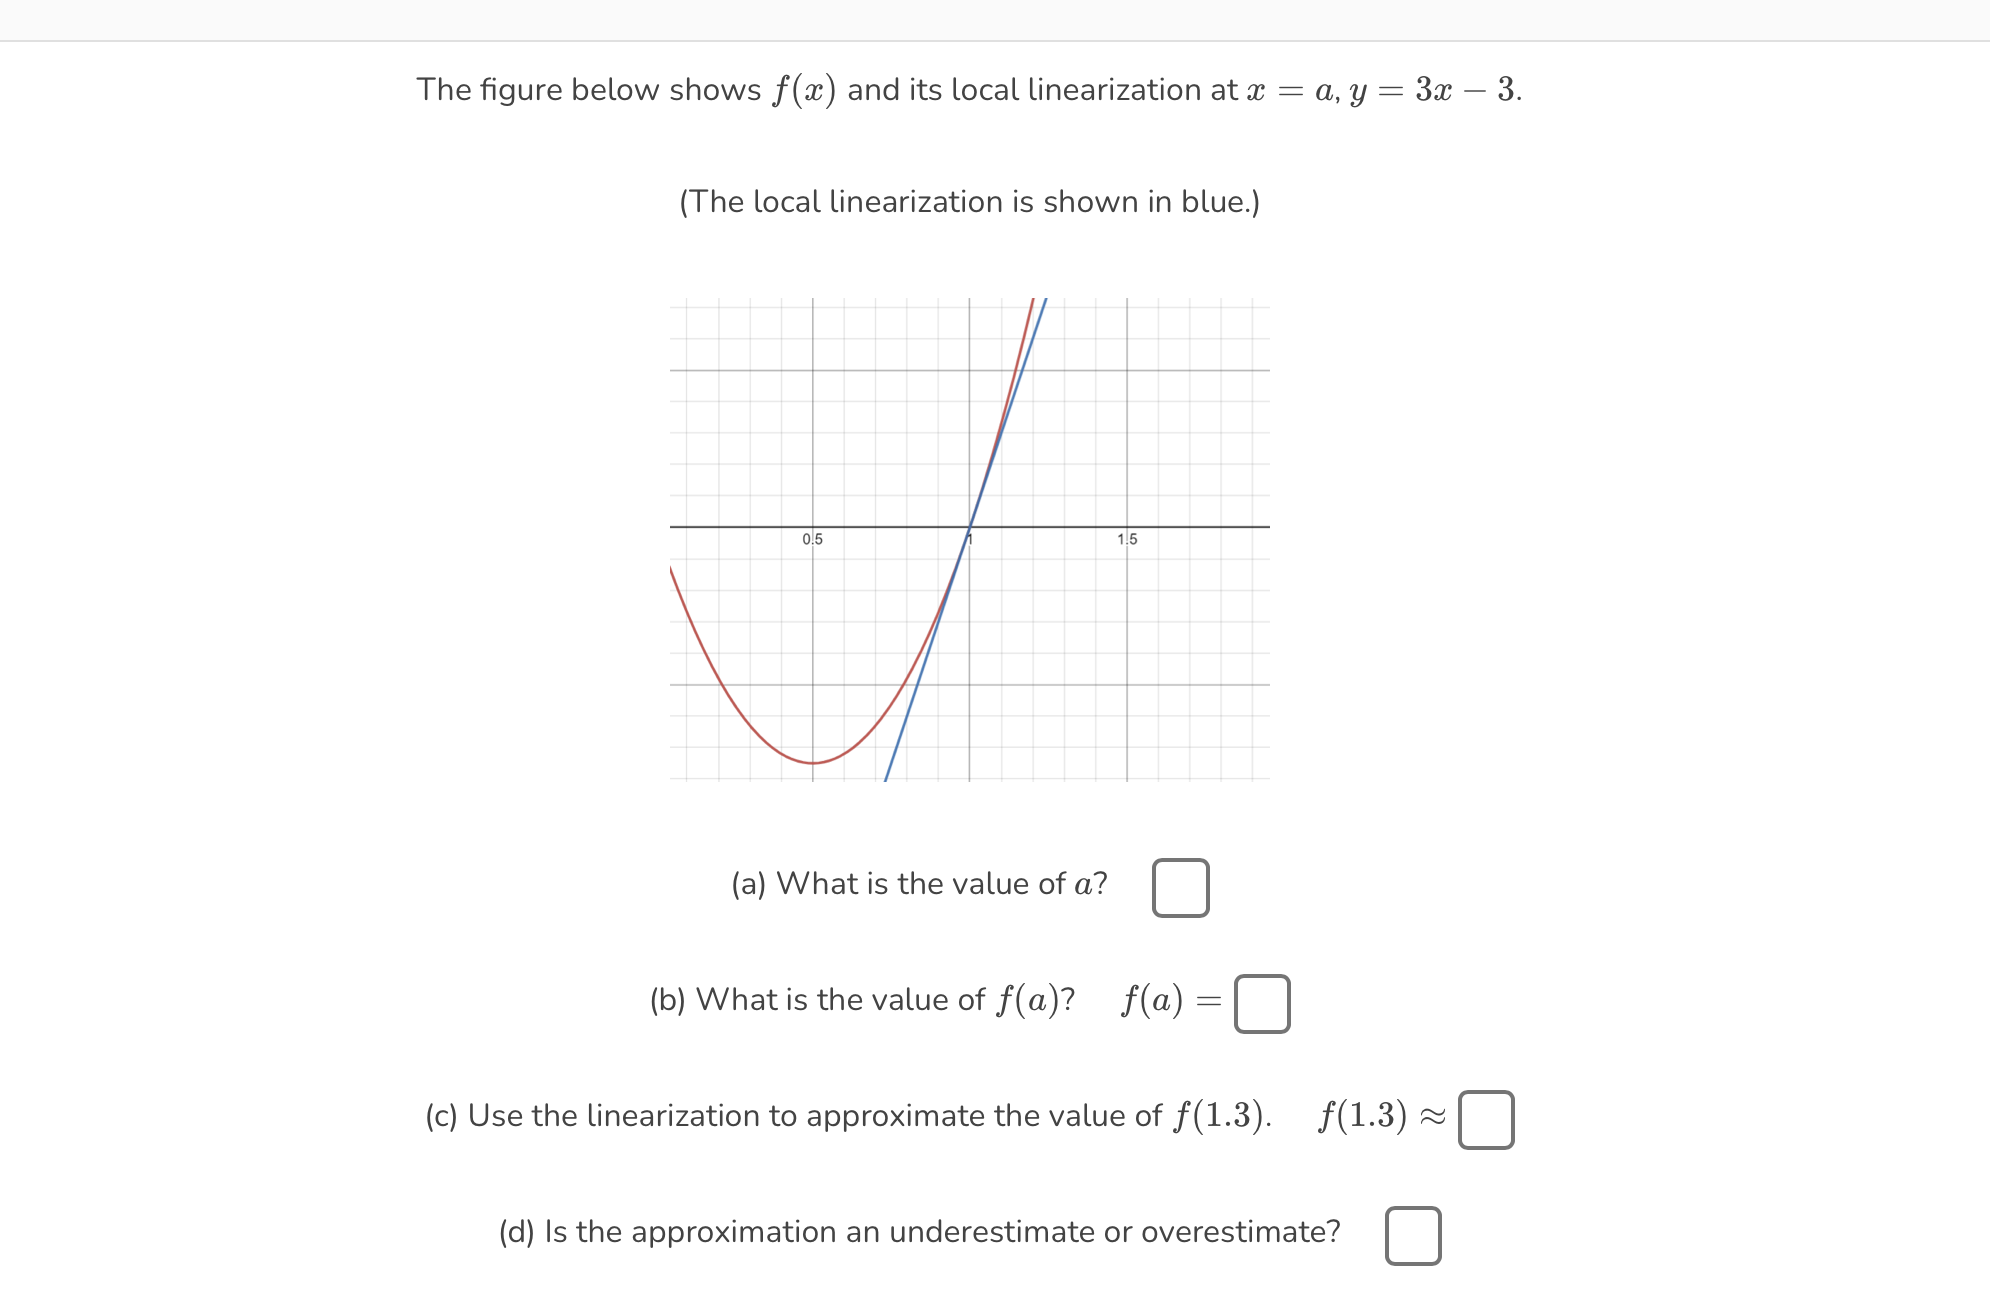


Using a calculator or computer, generate a graph Like the one shown below by graphing y : e3z 1 and y : 33$ for % S m S i (What is the relationship between y : e3"; 1 and y : 3w?) 0.5 -0.5 Use your graph to estimate to one decimal place the (largest) magnitude of the error in approximating e39\" 1 by 33: for % S a: S %. largest error % C] Is the approximation an overestimate or an underestimate? C] The gure below shows f(:1:) and its local linearization at :1: : a, y : 3a: 3. (The Local linearization is shown in blue.) 15 (a) What is the value of a? C] (b) What is the value of f(a)? f(a) : D (C) Use the linearization to approximate the value of f(1.3). f(1.3) m D (d) Is the approximation an underestimate or overestimate? D
Step by Step Solution
There are 3 Steps involved in it

Get step-by-step solutions from verified subject matter experts