

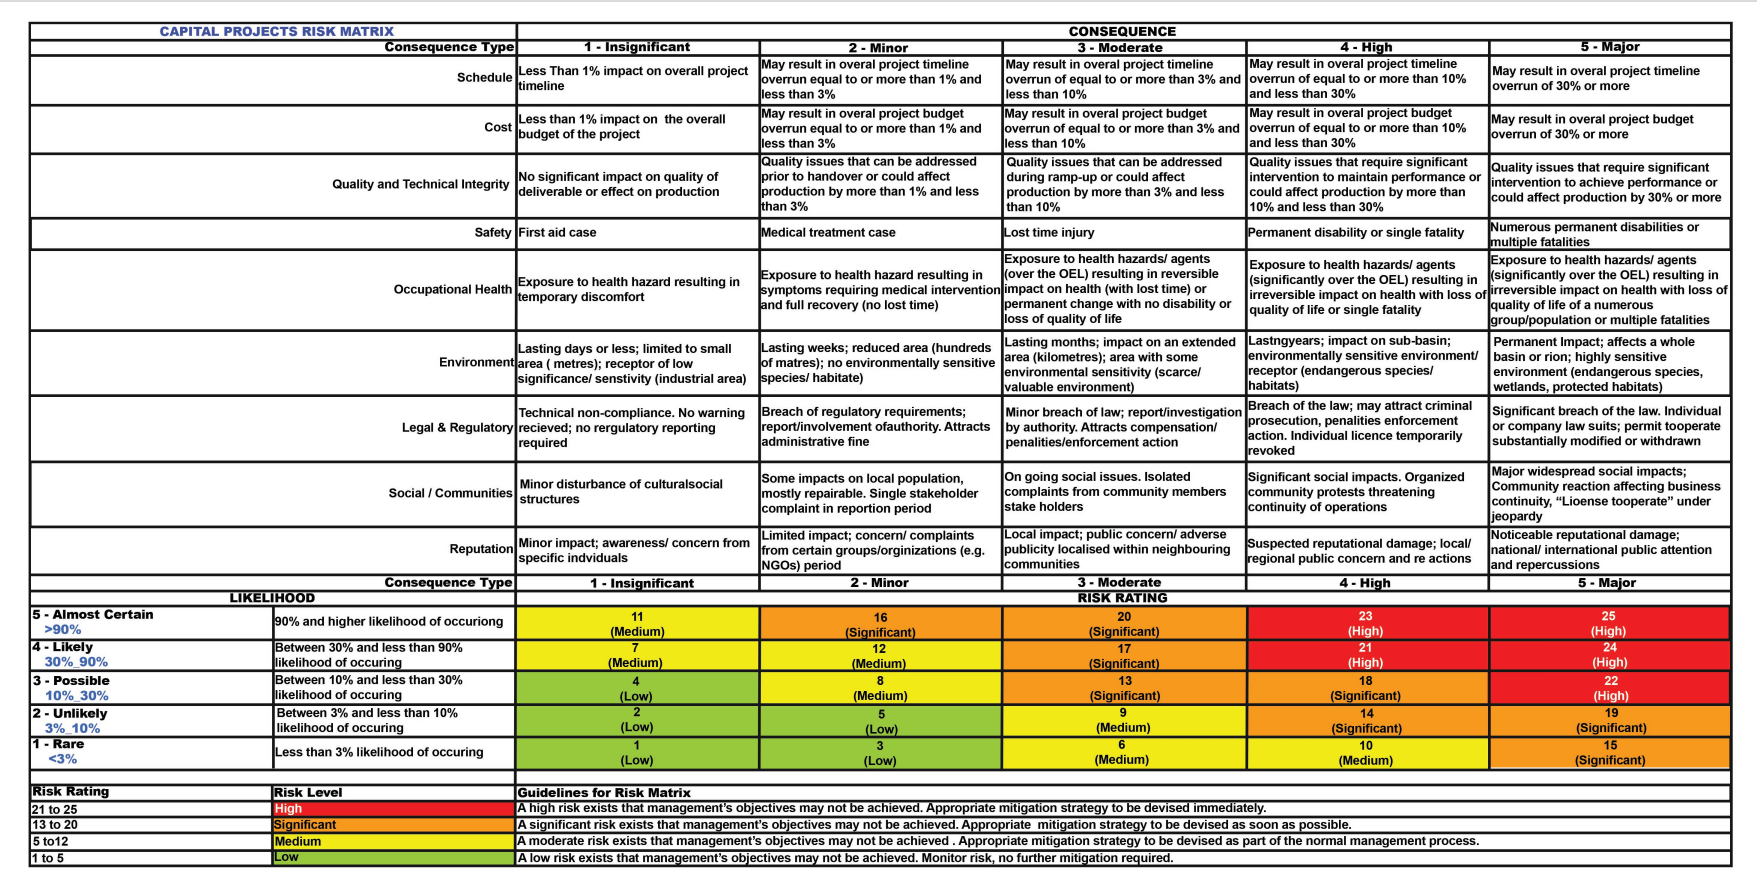
Question: Using a risk matrix, show how the proposed controls will assist the organization to manage the risks? you need to plot a graph showing the
Using a risk matrix, show how the proposed controls will assist the organization to manage the risks? you need to plot a graph showing the quadrants and where the risks are located & what happens to them as the controls are applied
Step by Step Solution
There are 3 Steps involved in it
1 Expert Approved Answer
Step: 1 Unlock

Question Has Been Solved by an Expert!
Get step-by-step solutions from verified subject matter experts
Step: 2 Unlock
Step: 3 Unlock